TL;DR: Want to convert a CSV to GeoJSON for QGIS, the free desktop mapping program? GeoJSON is a text file that stores map points together with their table columns. A coordinate reference system (CRS) is the rule that tells software where those numbers sit on Earth. The Geocluster agent can write the file from your collar or sample table, but the file stores no CRS, so ask for longitude and latitude. QGIS then reads it as WGS 84, and the points land in the right place. The result is a file copy, not a live link.
What Is GeoJSON, and Why Convert CSV to GeoJSON for QGIS?
This is a file-based workflow, not a live link between Geocluster and QGIS. Changes in one do not appear in the other. You export a point file once and load that copy into your desktop project.
To convert CSV to GeoJSON for QGIS, remember that a CSV table does not tell GIS software which columns hold coordinates. In a GeoJSON file, each row becomes a point with its table columns attached. That lets you open drillhole collars in QGIS next to surface samples. The GeoJSON standard says coordinates are WGS 84 longitude and latitude by default.
Getting collar and sample tables onto a desktop map is a routine task in exploration and target generation.
Wattle Creek Data Used in This Guide
Wattle Creek is a synthetic dataset released under CC0, not a real deposit. The files ship in the open-source Geocluster research harness under runtime/demo-bundles/wattle-creek/v1.
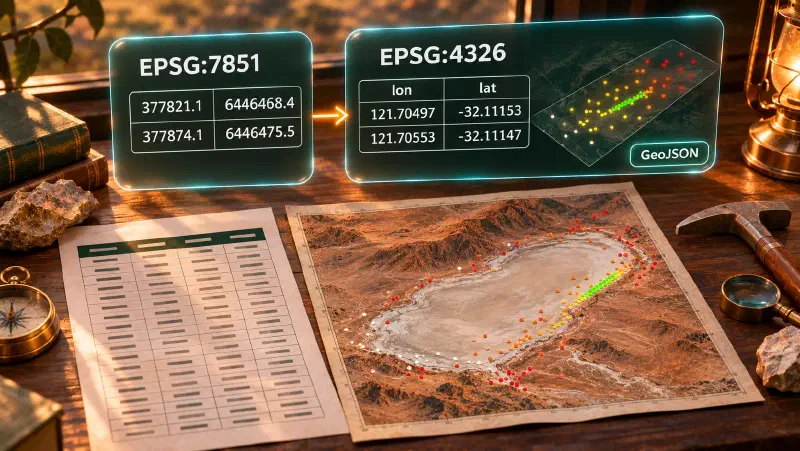
Both tables hold coordinates in metres in EPSG:7851, an Australian map grid (GDA2020 MGA zone 51). QGIS and GeoJSON expect EPSG:4326, which is longitude and latitude in degrees. Reprojecting means recalculating the coordinates from one system to the other.
| File | Rows | Columns | Notes |
|---|---|---|---|
drilling/collars.csv | 140 | hole_id, east, north, rl, total_depth, azimuth, dip | First hole WC001 at 377821.1 east, 6446468.4 north |
assays/surface_samples.csv | 196 | sample_id, sample_type, mga_east, mga_north, au_ppm, cu_ppm, as_ppm | 27 gold values written <0.005 (below detection) and 9 blank |
How to Convert CSV to GeoJSON for QGIS in Geocluster
Step 1: Why You Reproject Before You Convert
QGIS reads a GeoJSON file without a declared CRS as WGS 84. We checked this on the collar file: QGIS reports EPSG:4326 (WGS 84) for it. A file of metres would be read the same way, so its points would land in the wrong place. We did not test that case in QGIS.
For that reason, ask the agent for longitude and latitude, not for a straight conversion. We also replayed the open-source reproject and export_artifact tools of the harness on these files, outside the product. That replay showed three things:
- The exporter only detects columns named
x,lon,longitudeoreasting(and the Y equivalents). Columns namedeast,north,mga_eastormga_northreturnError: Could not auto-detect coordinate columns. - It writes no CRS. A file of metres exported this way would sit at latitude 6,446,468, which is not a valid position.
- The reprojection overwrites the original metre values with degrees in the same columns.
The replay used the open-source tools directly. We do not know whether the product agent calls those same tools. In our runs, the agent followed the column names and CRS we gave it in the prompt.
Step 2: Ask the Agent for a GeoJSON File
Open the Wattle Creek project, start the agent, and attach drilling/collars.csv with @. We used GPT-6 Luna at High effort. This is the prompt:
Reproject drilling/collars.csv from EPSG:7851 to EPSG:4326 using the east and north columns, rename the converted coordinate columns to lon and lat, and convert the table to GeoJSON. State the CRS you assumed, and save the file in this conversation's output folder.The agent returned collars_epsg7851_to_4326.geojson: 140 point features with lon and lat columns. It said it assumed the values are in EPSG:7851, as the prompt specified, because the CSV labels do not confirm the CRS. The prompt named the CRS and the new column names, so we did not test what the agent does without them. A REPORT file in Markdown, Word and PDF came with it.
The file landed in the run’s folder inside the project, at runs/<session>/results/, where <session> is a generated run name. The agent’s answer links to the file, and the file viewer has an Open in map button that shows the points on satellite imagery.
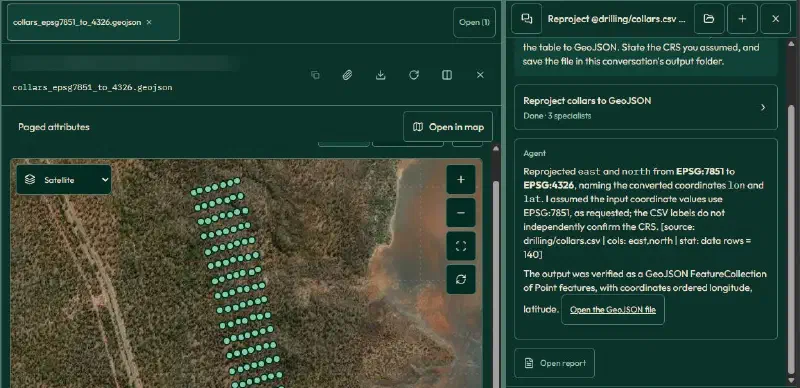
For the samples, attach assays/surface_samples.csv and run this prompt:
Do the same for assays/surface_samples.csv using the mga_east and mga_north columns: reproject from EPSG:7851 to EPSG:4326, rename the converted coordinate columns to lon and lat, state the CRS you assumed, and export to GeoJSON in this conversation's output folder. Keep the au_ppm column, leaving blank and below-detection values as they are in the source.The agent wrote surface_samples_reprojected.geojson with 196 point features. It reported that au_ppm was kept as in the source, with 9 blank values and 27 below-detection entries.
Step 3: Open the GeoJSON in QGIS and Check the CRS
Download both files from the results folder, then add them:
- Choose Layer, then Add Layer, then Add Vector Layer.
- Pick a
.geojsonfile under Source and click Add. - Double-click the layer to open Layer Properties, then read Assigned Coordinate Reference System (CRS) on the Source tab.
Both layers were assigned EPSG:4326 (WGS 84). The collars and samples overlaid correctly, and on a satellite basemap they fall on the same ground as in the Geocluster map: collars in a tight strip beside a salt lake, samples spread around them.
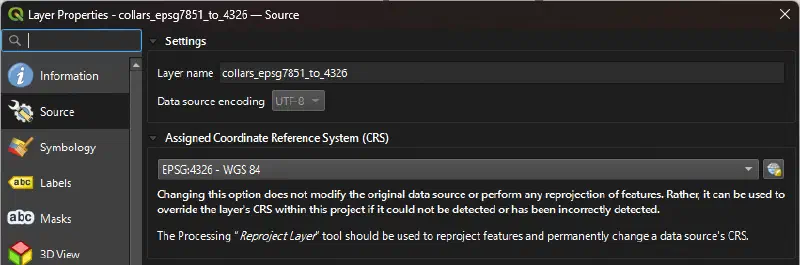
Step 4: Check the Attribute Types, Then Style the Points by Gold
Open the Fields tab of each layer. In both files, every column except lon and lat is Text (string). That includes rl, total_depth, azimuth, dip, au_ppm, cu_ppm and as_ppm.
The Graduated style colours points by number ranges, so it needs a numeric value. An expression can turn the text into numbers. In Symbology, choose Graduated and set Value to:
to_real("au_ppm")We used the Equal Count (Quantile) mode with 5 classes and clicked Classify. QGIS accepted the expression and built classes from 0.005 to 2.79 ppm. The file holds 160 numeric gold values with the same range.
With Show Feature Count on, the five classes held 35, 30, 31, 32 and 32 points. That is 160 of the 196 samples. The other 36 are the 27 <0.005 entries and the 9 blanks. They have no number, so they fall in no class and the legend shows no symbol for them. Add your own rule if you need those points on the map. Below-detection values also need one consistent rule, such as the one in handling detection limits.
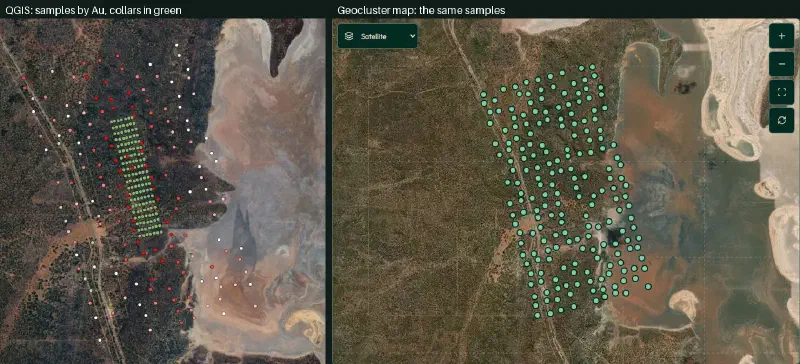
Limits of Converting CSV to GeoJSON for QGIS
- Text columns. The agent wrote every non-coordinate column as text. Use
to_real()before you style or filter by a number. - No CRS in the file. QGIS assigns WGS 84. Always check the CRS in Layer Properties and never export metres.
- Original coordinates replaced. The GeoJSON holds longitude and latitude only. Keep the source CSV for the EPSG:7851 values.
- Blank and below-detection gold. They stay as in the source (text). With
to_real("au_ppm"), those 36 of 196 samples fall in no class, so the gold colours cover only 160 points. - One run each. We ran each prompt once, on one model and effort setting. Our prompts named the CRS and the column names, and the agent chose the file names. Another run may differ.
- Points only. The files hold 2D points. They hold no hole traces or downhole intervals.
- File-based. Changes in QGIS do not return to Geocluster, and new Geocluster runs need a fresh export.
- Synthetic data. Wattle Creek is a demonstration set, not a real deposit.
FAQs
How do I convert a CSV with coordinates to GeoJSON?
Reproject the table to EPSG:4326, name the coordinate columns lon and lat, and write the result as GeoJSON. In our test run, one Geocluster agent prompt (GPT-6 Luna, High effort) did all three and saved the file in the run’s results folder. Ask the agent to state the CRS it assumed, and check that assumption against your source.
How do I check the CRS when importing a CSV or GeoJSON to QGIS?
Double-click the layer in the Layers panel to open Layer Properties. The assigned coordinate reference system is shown on the Source tab. A GeoJSON file without a declared CRS shows as EPSG:4326 (WGS 84), which is correct only if the file holds longitude and latitude.
Why do my points land in the wrong place in QGIS?
The file likely holds projected metres, but QGIS read them as WGS 84 degrees. GeoJSON stores no CRS here, so QGIS has no way to tell. Reproject the table to EPSG:4326 before you convert it. If the layer is already loaded, fix the source file rather than overriding its CRS.
How do I open drillhole collars in QGIS?
Ask the Geocluster agent to reproject your collar CSV to EPSG:4326 and save it as GeoJSON. Download the file, then use Layer, Add Layer, Add Vector Layer in QGIS. Each collar loads as a point. Hole attributes such as depth arrive as text, so convert them with to_real() to style by value.
Does Geocluster replace QGIS?
No. Geocluster reads and checks your tables and writes the files, and the agent runs the steps for you. QGIS remains the tool for desktop cartography, layouts, custom projections and styling across a local project. This guide only moves two point layers from one to the other.
Is there a live link between Geocluster and QGIS?
No. The workflow is file-based. You export a GeoJSON file from Geocluster and load that copy into QGIS. Edits in QGIS stay in QGIS, and new analysis in Geocluster needs a fresh export. Keep track of which file version your QGIS project uses.
Open Map Data From Geocluster in QGIS
Open the Wattle Creek sample project in Geocluster to reproject the collar and sample coordinates and write the GeoJSON files. Reprojecting to longitude and latitude first keeps your point layers aligned when you load them into QGIS.