
TL;DR: Want to correlate stratigraphy between drillholes without writing code? AI can help you decide when a layer in one hole is the same layer in the next hole. In the Geocluster workspace, four prompts to the built-in AI agent turn public drilling logs into rock columns, suggested matches and a final correlation diagram. The agent suggests and you decide, because two sandstones are not always the same layer. We show every step on six real holes from South Australia, including the four suggestions we changed.
What Does It Mean to Correlate Stratigraphy Between Drillholes?
A drillhole log records the rock at each depth. To correlate stratigraphy between drillholes, you decide which boundary in one hole is the same geological boundary in its neighbours. The result of drillhole stratigraphic correlation is a diagram: hole columns side by side, with a line joining each matched boundary. Some geologists say borehole rather than drillhole. You may also see this task written as correlate stratigraphy between boreholes, or correlate geological layers between boreholes.
The key idea is that lithology is not stratigraphy. Lithology is the rock type a geologist records. Stratigraphy is the named unit that rock belongs to. Two sandstone intervals may be different units, and one unit can contain several rock types.
A correlation answers four questions:
- Same unit? Is this the same formation in both holes, even where the logged rock differs?
- Thicker or thinner? Does a unit really change thickness between holes?
- Moved by a fault? Has a fault shifted the layers up or down?
- Missing? Is a unit truly absent from a hole, or only absent from its log?
Part 1 of this series showed measured assays along each hole, with nothing interpreted. Correlation is the first interpretive step.
It matches boundaries from hole to hole and says nothing about the ground in between. That is the job of a geological cross section, which comes later.
Drillhole Data Used in This Guide
Our earlier lithology guide used logs with rock codes but no named units, and those cannot show stratigraphy. So this guide moves to the SARIG Data Package, the South Australian government’s public export of drilling records. It covers 374,082 drillholes, and thousands of them have both a rock log and a stratigraphic log.
We use six holes from the Carrapateena project area, on a north-south line about 200 m apart. We cut the SARIG exports down to these six holes and kept every column unchanged. To follow along, download the three full exports:
- sarig_dh_details_exp.csv (140 MB): position, elevation and depth of each hole
- sarig_dh_litho_exp.csv (402 MB): the rock intervals
- sarig_dh_strat_exp.csv (58 MB): the named unit intervals, for step 3 only
Keep only the rows with DRILLHOLE_NO 265018, 265016, 264999, 265043, 265001 or 265006, and save them as sarig_six_holes_details.csv, sarig_six_holes_litho.csv and sarig_six_holes_strat.csv. These files are large, so use a script or a tool built for large CSV files.
Source: The Department for Energy and Mining, the Government of South Australia, The SARIG Data Package, Sourced on 9 November 2026, https://dem-sdp.s3-ap-southeast-2.amazonaws.com/index.html.
Licensed under CC BY 4.0. We filtered the exports to six holes and derived the figures in this guide from them. The Government of South Australia does not endorse this guide.
Three things about this data shape the steps below:
- All six holes are vertical. Elevation, written as RL (reduced level), is the collar elevation minus depth, so no survey file is needed.
- Both logs come from the same source. One company logged these holes, so agreement between the two logs shows consistency, not independent proof.
- The stratigraphic log waits until step 3. The agent first suggests matches without seeing the answer.
How Do I Correlate Stratigraphy Between Drillholes in Geocluster?
To correlate stratigraphy between drillholes, send four prompts one at a time in the same conversation, and wait until each one finishes. Your own judgment comes in at step 4.
Step 1: Draw the Holes Side by Side
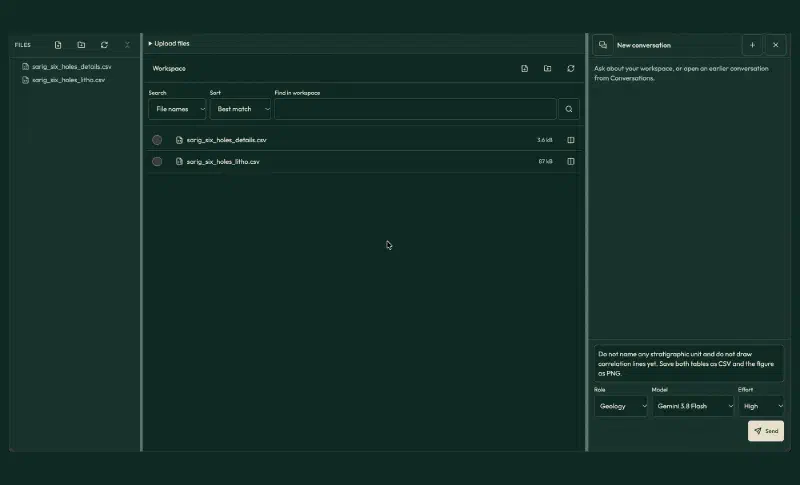
First, upload sarig_six_holes_details.csv and sarig_six_holes_litho.csv to a new Geocluster project. Then put the rock logs on one picture at their true elevations:
The two CSV files are from the South Australian SARIG drillhole database: hole details and lithology logs for six vertical holes on a north-south line. Join them on DRILLHOLE_NO and use DH_NAME as the hole name.

1. Make a collars table with hole, easting, northing, collar_rl (ELEVATION_M) and total_depth (MAX_DRILLED_DEPTH).
2. Make a lithology table with hole, from_m, to_m, top_rl, base_rl, major_code, minor_code and description. RL is collar_rl minus depth. Keep every row and every description unchanged.
3. Check each hole for depth gaps, overlaps and rows whose description disagrees with the major code. List them and do not fix them.
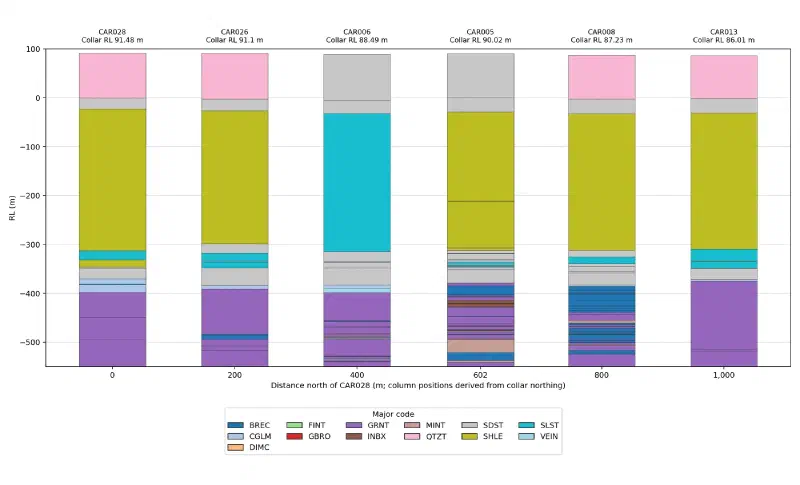
4. Draw the holes as side-by-side lithology columns, south to north: CAR028, CAR026, CAR006, CAR005, CAR008, CAR013. Space them by real northing distance. Use RL on the vertical axis from +100 m to -550 m. Colour by major_code with one shared legend, and label each column with the hole name and collar RL. No figure title.

Do not name any stratigraphic unit and do not draw correlation lines yet. Save both tables as CSV and the figure as PNG.
The agent saved six collars and 322 lithology rows, and it found no depth gaps or overlaps. We compared every row with the source files and they all match.
The agent also listed 46 rows where the description names a different rock from the code. Only five sit above the granite basement, the older rock under the sediments, and these two cases matter most:
- CAR006, 121 to 403.2 m: coded siltstone (
SLST) but described as shale. - CAR006, 0 to 93 m, and CAR005, 0 to 89 m: coded sandstone (
SDST) but described as quartzite.
That explains the odd column in the figure. The large light blue block in CAR006 is described as shale, just like the olive blocks in its neighbours. Rock codes alone would miss that match.
Step 2: Let the Agent Suggest Contacts
A contact is the boundary between two units. This prompt asks for candidate contacts from the rock log only, with evidence and a confidence level for each:
Using only collars.csv and lithology.csv from the last step, propose candidate contacts that can be traced across the six holes. A contact means the same geological boundary in each hole. Call them C1, C2 and so on from the top down. Do not name stratigraphic units and do not use outside knowledge of this area.

Read the descriptions as well as the codes, because the same rock can carry different codes in different holes. Treat a row whose description says it has no sample as unknown rock.

1. Make candidate_contacts.csv with one row per contact per hole: contact, hole, depth_m, rl, rock_above, rock_below, evidence, confidence (high, medium or low), alternative_depth_m. If a contact cannot be placed in a hole, leave depth_m blank and explain why.
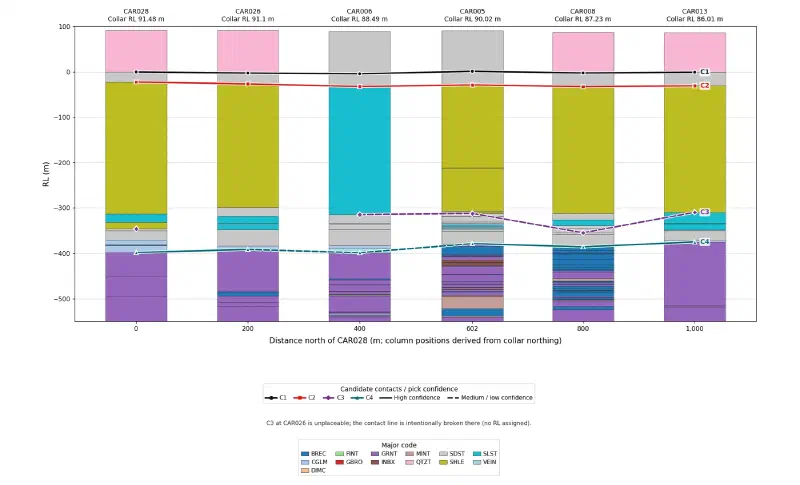
2. Redraw the lithology columns with the same order, spacing and RL range and no figure title, then draw each contact as a line joining the holes. Use solid lines for high confidence and dashed lines for medium or low. Label each line C1, C2 and so on.
3. In your report, list the holes where a pick was hard and what a geologist should check before accepting it.

These are suggestions for a geologist to accept or reject, so do not state them as facts. Save the table as CSV and the figure as PNG.
The agent proposed four contacts. Depths are in metres:
| Contact | CAR028 | CAR026 | CAR006 | CAR005 | CAR008 | CAR013 |
|---|---|---|---|---|---|---|
| C1: quartzite to sandstone | 92 | 94 | 93 | 89 | 90 | 87 |
| C2: sandstone to shale | 114 | 118 | 121 | 119 | 120 | 117 |
| C3: base of the shale | 437.8 | none | 403.2 | 402.3 | 442 | 395.8 |
| C4: top of granite-bearing rock | 489.7 | 482.7 | 487.3 | 468.7 | 473.1 | 461 |
Each line tells you something different:
- C1 and C2 are high confidence. The agent read the descriptions, so the odd codes in CAR006 and CAR005 did not fool it.
- C3 is medium confidence. It drops by more than 30 m at CAR028 and CAR008, because both picks sit at the last row that mentions shale.
- CAR026 has no C3 pick. Its log reads “Mud rotary. No sample” from 390 to 409.2 m, so the rock there is unknown.
- C4 is medium confidence in CAR006, because a quartz vein sits between the last conglomerate and the first granite.
Step 3: Compare the Suggestions With the Stratigraphic Log
Now upload sarig_six_holes_strat.csv to the same project. It names five units from top to bottom: Simmens Quartzite Member, Corraberra Sandstone Member, Tregolana Shale Member, Whyalla Sandstone and Donington Suite. This prompt treats that log as another logger’s view, not as the truth:
I uploaded sarig_six_holes_strat.csv, a stratigraphic log for the same six holes from the same SARIG database. Join it on DRILLHOLE_NO. Treat it as another logger's interpretation, not as the truth.

1. Make unit_tops.csv with one row per hole per named unit: hole, unit, top_m, base_m, top_rl, thickness_m. Join consecutive rows of the same unit. If a unit has no row in a hole, leave it out and do not infer it.
2. Make contact_review.csv with one row per candidate contact per hole: contact, hole, candidate_depth_m, alternative_depth_m, matching_unit_top_m, difference_m, recommendation (accept, use alternative, reject or cannot decide) and reason. Base each reason on the lithology row and on the RL of the same contact in the neighbouring holes.
3. In your report, answer these four questions for this line, with hole names and numbers:
- Is the same named unit present even where the rock codes differ?
- Which units change thickness, and is each change real or caused by a pick?
- Is there a fault? A fault should move every contact by about the same amount, so give the RL change of each contact between neighbouring holes.
- Is a unit missing? Say whether the rock is absent or only the log row is absent.

These are recommendations for a geologist. Do not change the earlier files and do not draw a new figure yet.
The unit table has 29 rows, and all of them match the source. The comparison then shows where the suggestions hold:
- C1 and C2: all 12 picks match the unit tops exactly.
- C4: five of six match exactly. In CAR006, the agent’s alternative of 478.35 m is the one that matches.
- C3: CAR013 matches exactly and CAR006 is within 0.2 m. CAR005 matches through its alternative of 397.03 m, while CAR008 is 42.5 m deeper than the log’s 399.5 m.
- CAR028: its log has no Whyalla row, so its Tregolana Shale reads 375.7 m, against 272 to 282 m in the other five holes.
The agent recommended accepting C1, C2 and C4, and it marked C3 as “cannot decide” in all six holes. That leaves the last call to the geologist, which is the point of this workflow.
Step 4: Accept or Reject Each Contact
We kept 19 of the 24 picks. These are the other five:
| Pick | Agent’s suggestion | Our decision | Reason |
|---|---|---|---|
| C3, CAR028 | 437.8 m | 404.5 m (its alternative) | The long shale row ends at 404.5 m. The deeper pick sits about 32 m below this contact in CAR006. |
| C3, CAR026 | No pick | Left unplaced | From 390 to 409.2 m there is no sample, so the contact cannot be placed. |
| C3, CAR005 | 402.3 m | 397.03 m (its alternative) | The long shale package ends here, and the log puts the unit top at 397.05 m. |
| C3, CAR008 | 442 m | 399.48 m | The long shale row ends here, and the log agrees at 399.5 m. The deeper pick sits 45 m or more below both neighbours. |
| C4, CAR006 | 487.3 m | 478.35 m (its alternative) | This is the base of the last conglomerate. The quartz vein lies below it. |
Next, send those decisions back with the unit names and ask for the final diagram:
I reviewed contact_review.csv as the geologist. Use these decisions and no others.

C1 and C2: accept all six picks.
C3: CAR028 404.5 m, CAR006 403.2 m, CAR005 397.03 m, CAR008 399.48 m, CAR013 395.8 m. Leave CAR026 unplaced, because 390 to 409.2 m has no sample.
C4: CAR028 489.7 m, CAR026 482.7 m, CAR006 478.35 m, CAR005 468.7 m, CAR008 473.1 m, CAR013 461 m.

Why: the picks at 437.8 m in CAR028 and 442 m in CAR008 sit 30 to 50 m below this contact in the neighbouring holes, inside mixed sandstone and shale. In CAR006 the quartz vein lies below the last conglomerate, so the contact is the base of the conglomerate.

Name the intervals: above C1 Simmens Quartzite Member, C1 to C2 Corraberra Sandstone Member, C2 to C3 Tregolana Shale Member, C3 to C4 Whyalla Sandstone, below C4 Donington Suite. CAR028 has no Whyalla row in the stratigraphic log, so mark its Whyalla interval as inferred from the lithology log.

1. Make final_contacts.csv with contact, hole, depth_m, rl and decision (accepted, changed or unplaced).
2. Make final_thickness.csv with the thickness of Corraberra, Tregolana and Whyalla in each hole. Leave Tregolana and Whyalla blank in CAR026 and give their possible range in a note.
3. Make rl_changes.csv with the RL change of each contact between neighbouring holes, north minus south.
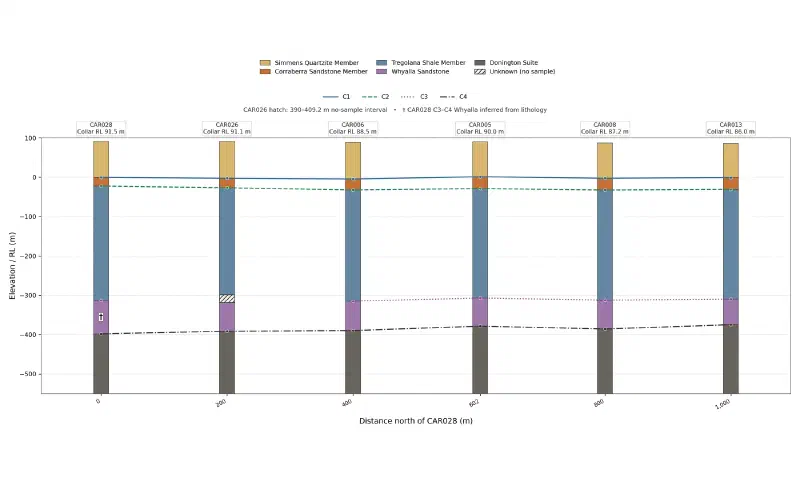
4. Draw the correlation diagram: six columns south to north, spaced by real distance, RL +100 m to -550 m, each column coloured by named unit, with a line joining each contact between holes. In CAR026 colour Tregolana down to 390 m and Whyalla from 409.2 m, hatch the no-sample interval between them, call it "Unknown (no sample)" in the legend, and break the C3 line there. Keep a C3 marker at CAR028. Label each hole and collar RL. Mark the inferred interval in CAR028. Label the horizontal axis "Distance north of CAR028 (m)". No figure title.
5. Draw the same diagram flattened on C2, with C2 at 0 m in every hole, from +130 m to -420 m, so thickness changes show directly.

Save the tables as CSV and the figures as PNG.
The final tables match our own calculation from the source files. The first figure shows the units at their true elevations.
The second figure sets C2 to zero in every hole. Flattening removes the differences in elevation, so thickness changes show directly. We chose C2 because it is a sharp sandstone to shale contact, picked at the same depth in both logs in all six holes.
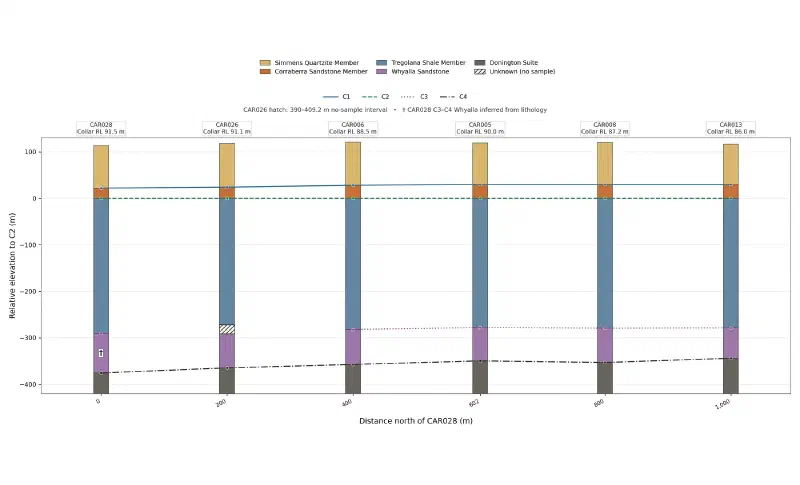
Step 5: Answer the Four Questions
Same unit? Yes. The five units keep the same order in all six holes, with Whyalla inferred in CAR028. That holds even where the codes differ, as they do in CAR006.
Thicker or thinner? Yes, in two places. Corraberra thickens to the north across two clear contacts, and the package from C2 to C4 thins from 375.7 m in CAR028 to 344 m in CAR013.
| Hole (south to north) | Corraberra (m) | Tregolana (m) | Whyalla (m) |
|---|---|---|---|
| CAR028 | 22 | 290.5 | 85.2, inferred |
| CAR026 | 24 | 272 to 291.2 | 73.5 to 92.7 |
| CAR006 | 28 | 282.2 | 75.15 |
| CAR005 | 30 | 278.03 | 71.67 |
| CAR008 | 30 | 279.48 | 73.62 |
| CAR013 | 30 | 278.8 | 65.2 |
The 375.7 m Tregolana in the original CAR028 log is not a real change. It comes from the unit split that the log leaves out.
Moved by a fault? The data does not support one. A fault would shift every contact by about the same amount and leave a step. These are the elevation changes between neighbouring holes, in metres, north minus south:
| Holes | C1 | C2 | C3 | C4 |
|---|---|---|---|---|
| CAR028 to CAR026 | −2.38 | −4.38 | n/a | +6.62 |
| CAR026 to CAR006 | −1.61 | −5.61 | n/a | +1.74 |
| CAR006 to CAR005 | +5.53 | +3.53 | +7.70 | +11.18 |
| CAR005 to CAR008 | −3.79 | −3.79 | −5.24 | −7.19 |
| CAR008 to CAR013 | +1.78 | +1.78 | +2.46 | +10.88 |
The largest shared move is at CAR005. Its contacts rise by 3.5 to 11.2 m and then fall by 3.8 to 7.2 m at the next hole. That is a small bump that comes back, not a step, and the contacts do not move equally.
Missing? Not here. CAR028 has no Whyalla row, yet its rock log shows 85.2 m of siltstone, shale, sandstone and conglomerate at the depth where its neighbours have Whyalla. The log row is missing, not the rock.
Limits of This Stratigraphic Correlation
When you correlate stratigraphy between drillholes from logs alone, the result carries these limits:
- Suggestions, not facts. Our final picks rest on the logs and on neighbouring elevations. Have a geologist who knows the area review them.
- Not an independent test. One company logged both records, and most stratigraphic contacts sit on rock log row boundaries.
- Logs only. Marker beds, multi-element geochemistry and gamma logs would give independent evidence, and we use none of them here.
- Inferred and open picks. Whyalla in CAR028 is inferred, and C3 in CAR026 stays open across a 19.2 m gap.
- Incomplete units. Simmens starts at the surface and Donington ends where the log ends, so their thicknesses are not true unit thicknesses.
- Hole spacing. With holes 200 m apart, a small fault between two holes can go unseen.
- Not a model. The lines join matched contacts. They do not predict the rock between holes.
- Yearly updates. The SARIG package changes each year, so a later download may not match the counts and depths here, which come from the package sourced on 9 November 2026.
- Check the written summary. Treat the saved tables and figures as the result, and verify historical drilling data against its source. We recomputed every depth, elevation and thickness in this guide from the source files.
FAQs
What is stratigraphic correlation between drillholes?
Stratigraphic correlation is the matching of equivalent rock units and boundaries from one drillhole to the next. A geologist compares rock sequence, elevation, thickness and other evidence, then joins the matched boundaries on a diagram. The result shows which layers continue between holes and how they change, before anyone models the ground between them.
Why is lithology not the same as stratigraphy?
Lithology describes the physical rock, such as sandstone or shale. Stratigraphy places that rock in a named unit with a position in a sequence. Two sandstones in different holes can belong to different units, and one unit can hold several rock types, so matching rock codes alone can give a wrong correlation.
Can an AI agent correlate drillholes on its own?
An agent can tabulate logs, propose contacts, give its evidence and compare them with other logs quickly. In this guide it matched the two clearest contacts in every hole and left a harder one undecided. Treat its output as candidates, and have a geologist accept or reject each pick with a recorded reason.
How do you tell a fault from a change in thickness?
Compare how several contacts change in elevation between neighbouring holes. A fault tends to shift every contact by about the same amount and leave a step. A thickness change moves only the contacts on one side of the unit that changes. Close hole spacing and structural logs make the difference easier to see.
What does it mean if a unit is missing from a drillhole log?
The unit may be truly absent, but the hole may also have stopped short, skipped sampling, or had the unit left unsplit by the logger. Check the rock log at that depth and the same interval in neighbouring holes. In this guide, one apparently missing unit turned out to be a missing log row.
Why flatten a correlation diagram on one contact?
Flattening sets one chosen contact to the same level in every hole, which removes differences in elevation. Thickness changes above and below that contact then show directly. Choose a sharp, reliable contact for this datum, because any error in that pick shifts the whole column for that hole on the diagram.
Correlate Stratigraphy in Geocluster
Open the Geocluster web workspace to correlate stratigraphy between drillholes in your browser, without writing code or setting up servers. Create a project, upload your six-hole files (or your own logs), and send the four prompts above. You get candidate contacts to review and a correlation diagram built from your decisions.