Key Takeaways
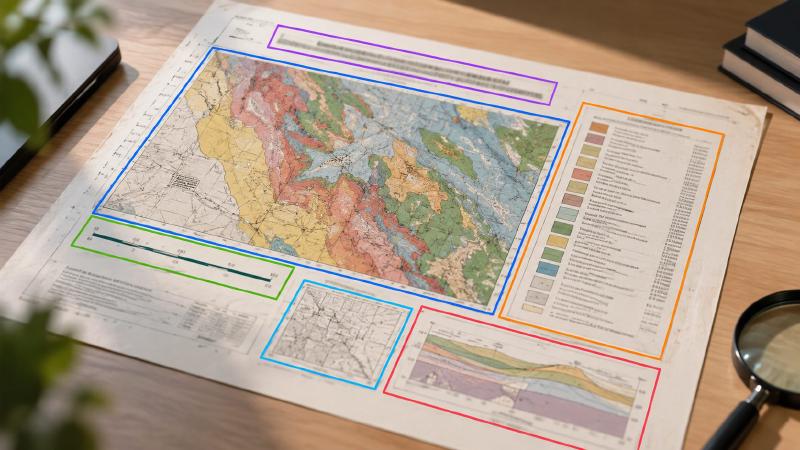
- A geologic map shows which rocks lie where, each type of rock in its own colour. One sheet also holds a legend (the key that says what each colour means), a title, a scale bar and more. Machine learning in geology, software that has learned from many example maps, can find each of these parts.
- It draws a box around each part of a scanned map, like someone marking a busy page with a highlighter. Then it hands back a cut-out picture of every part.
- It does not read words. In the legend it finds the small coloured squares, but it leaves the rock names beside them blank rather than guess. A person or a text-reading tool fills them in.
TL;DR
Before an AI assistant can use an old scanned map, it has to know which part of the page is the map and which is the legend. This tool puts a box around each part and cuts it out. It sees shapes and colours, never words.
What Is geomap_process_image?
geomap_process_image is the map-detection tool in Stratigraphic Amenity, Eigenform’s open-source (MIT) MCP server for scanned geologic maps. It runs the first stage of Microsoft’s PEACE research workflow, called HIE (hierarchical information extraction): taking a map sheet apart before anything reads it.
The tool takes exactly one input, the map_id or map_uri returned when the map was registered. It then runs two YOLOv10 object-detection models trained by the PEACE project. The first finds eight kinds of region on the sheet; the second looks inside the legend for colour swatches and text blocks. It is machine learning in geology doing a narrow, checkable job: finding where things are, not saying what they mean.
How Do I Detect the Parts of a Geologic Map With AI?
Three things decide whether the result is usable.
Check that map processing is ready
The detector needs model weights, a runtime and several Python packages, so it is often the last part of a server to become ready. Run the capability check first and call this tool only when map_processing.ready is true.
If the detector is missing, the error lists what is outstanding and how to fix it from an MCP client. Missing Python packages are different: the operator installs them and restarts the server.
Read the regions and the cut-outs
The result always lists eight region types: title, main_map, legend, scale, index_map, cross_section, stratigraphic_column and others. Each found region has a bounding box, a confidence score and a geomap:// link to its cropped image, and the summary marks any score below 0.5 as low_confidence.
Two crops get extra work. The tool cuts the four corners of the main map, each 10% of its width and height, into one 2 by 2 picture, because the printed grid coordinates usually sit there. Those numbers become the control points for georeferencing the map. It also draws every box onto one overview image.
Use source coordinates, not the preview
Every box is measured on the full-resolution scan and the payload says so with coordinate_frame: "source". The tool may also attach a preview of the overview image, shrunk to at most 1,536 pixels on its long side, which carries coordinate_frame: "preview". The two frames often differ by more than 1.5 times, so an agent must never measure a position on the preview and treat it as a map coordinate.
Why the Legend Labels Come Back Empty
The legend detector finds colour swatches and text blocks, a geometric rule pairs each swatch with the text beside it, and the tool reads each swatch’s colour. It does not read the words. This build of the server ships no OCR (optical character recognition), so every legend entry returns label: null with label_extraction: "not_available", and the result carries a warning saying so.
That is deliberate, and a lesson for machine learning in geology generally. In testing, agents that saw a tidy list of colours filled in plausible rock names on their own. Now the count is reported as “legend extracted candidates (not a verified map-unit count)”, and the names have to come from the user or a separate OCR or vision model. Our legend extraction write-up covers how swatches are paired with text and how colours are measured.
Three more limits matter to an agent. Only the first legend and the first main map on a sheet are analysed. Each call recalculates everything and overwrites the stored result, so the tool is not idempotent. And the models run on CPU, so a large scan takes a while.
FAQs
What does geomap_process_image detect on a geologic map?
It is a typical use of machine learning in geology: object detection. It finds eight kinds of region: title, main map, legend, scale, index map, cross-section, stratigraphic column and others. For each one it returns a bounding box, a confidence score and a cropped image. In the legend it also reports each swatch’s colour.
Why are legend labels null?
The server includes no OCR, so it never reads the words printed in the legend. Each entry returns label: null and label_extraction: "not_available". Agents should report such entries as unlabelled and get the names from the user or a separate OCR or vision model, never by guessing from the picture.
Can an agent measure coordinates on the preview image?
No. The preview is a shrunken copy with its own coordinate frame. Every box in the result is measured on the full-resolution scan. A position read off the preview can be wrong by a factor of 1.5 or more.
What should an agent do if map processing is not ready?
Read the error’s list of missing requirements. If geomap_prepare_detectors is available, ask the user before calling it, because it downloads about 200 MiB. Missing Python packages need the server operator. Never install the detector from the agent’s own shell.
Try It With Geocluster
Stratigraphic Amenity is one of the Geocluster tools, MCP servers that let AI agents work with geology data and maps.
The step before this one is loading a scanned geologic map, which gives the map the ID this tool needs.