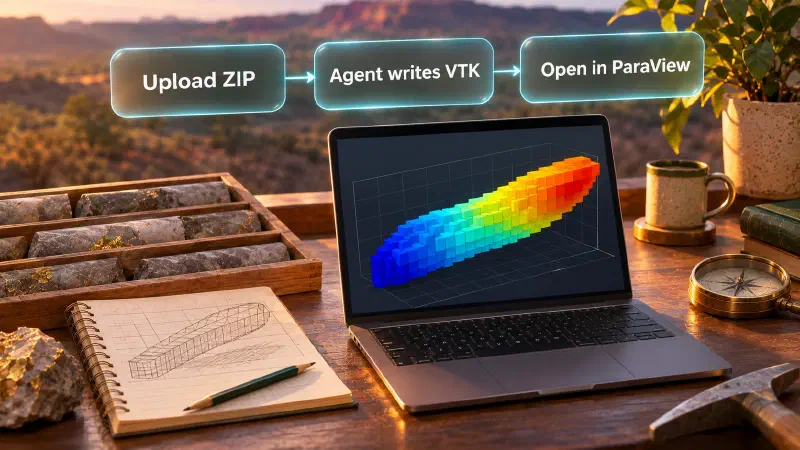
TL;DR: To open a voxel model in ParaView, you ask the Geocluster agent to turn your voxel ZIP file into a VTK file, a plain 3D data format that ParaView, a free desktop viewer, can load. A voxel model is a 3D grid of small blocks, like pixels in a picture but with depth. The grid also contains empty blocks, so you use a filter in ParaView to hide them and then colour the remaining blocks by their score.
What Is a Geocluster Voxel Model in ParaView?
When you build a 3D grid in Geocluster, the download is a ZIP file holding binary NumPy arrays and a JSON description. Geocluster has no VTK export button. In this guide you upload the ZIP to your project and the Geocluster agent writes the VTK file on request, so ParaView can open the grid. It is a way to convert a NumPy array to VTK without writing code. We call this a conversion workflow, not an export.
The VTK file carries the grid origin and cell spacing in metres, but ParaView does not read a coordinate reference system (CRS, the map projection that ties numbers to places on Earth) from it. For the example here, the horizontal coordinates are in EPSG:28351 (GDA94 / MGA zone 51). The vertical axis is depth below the drill hole collar (the surface start of a borehole), not elevation above sea level.
The voxel is a screening construction from public drilling data, not a resource model, not a prospectivity model and not a measurement. It combines high-grade gold intersections (at least 0.1 ppm), target lithology and alteration, folded over depth, smoothed about 350 m and cut to the strongest 12% of the window. Its value has no unit, so the colour bar is labelled “Intersection footprint (score)”, never ppm. Teams that want to see the borehole traces before gridding can start with a drill hole visualization workflow.
Data Used in This Guide
The data are public exploration drilling results from the Central Laverton area of Western Australia, report A114051 in the WAMEX mineral exploration database. Credit goes to the Department of Energy, Mines, Industry Regulation and Safety, Government of Western Australia.
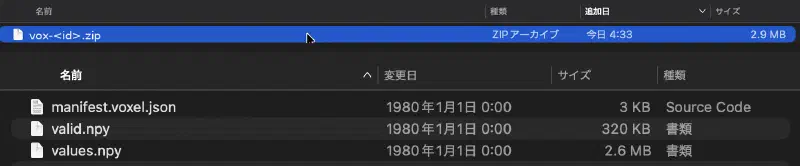
The voxel is the same Existing-grid intersection_footprint result used in the Blender voxel guide, which also shows how it was made in Geocluster. The ZIP holds three files: manifest.voxel.json, values.npy and valid.npy. There is no counts.npy, because the cell values were supplied directly rather than counted from samples.
The grid is 200 x 200 x 8 cells (320,000 in total), each 70 x 70 x 10 m, in EPSG:28351. Of these, 38,400 cells are valid, with scores from 0.0012357 to 0.0691373.
How Do I Open Voxel Model in ParaView From Geocluster?
Step 1: Upload the Voxel ZIP to Your Geocluster Project
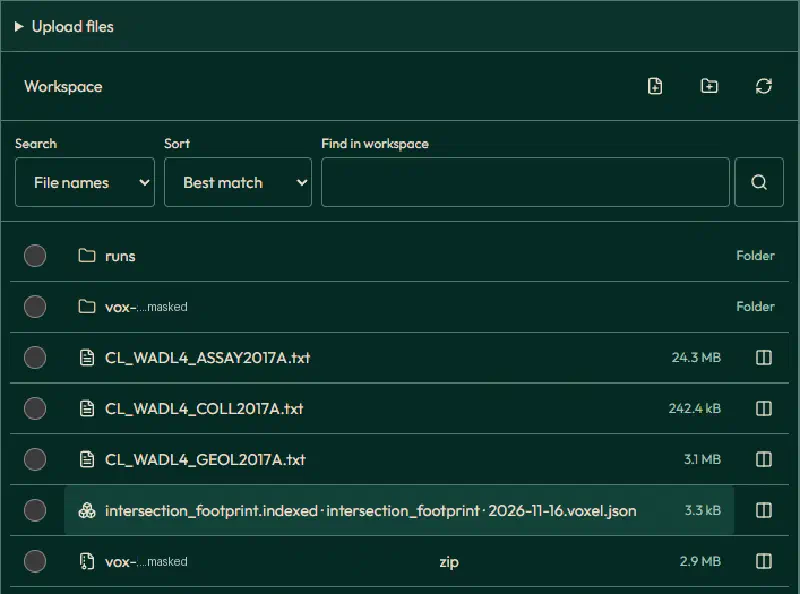
The agent works on files in your project workspace, and the ZIP you download from Create voxel is not placed there. When we asked the agent to find the downloaded bundle, it reported that it could not find manifest.voxel.json, values.npy or valid.npy.
Upload the ZIP with Upload files in the workspace. Geocluster extracts it into a folder named after the voxel, with the three files inside, so you do not need to unzip it yourself. Wait until all three files show as done.
Step 2: Ask the Geocluster Agent to Write the VTK File
Attach the extracted folder to your message with @ and send the prompt below. We ran it with GPT-6 Luna at High effort. The folder name in your project will differ, so pick it from the list instead of typing it.
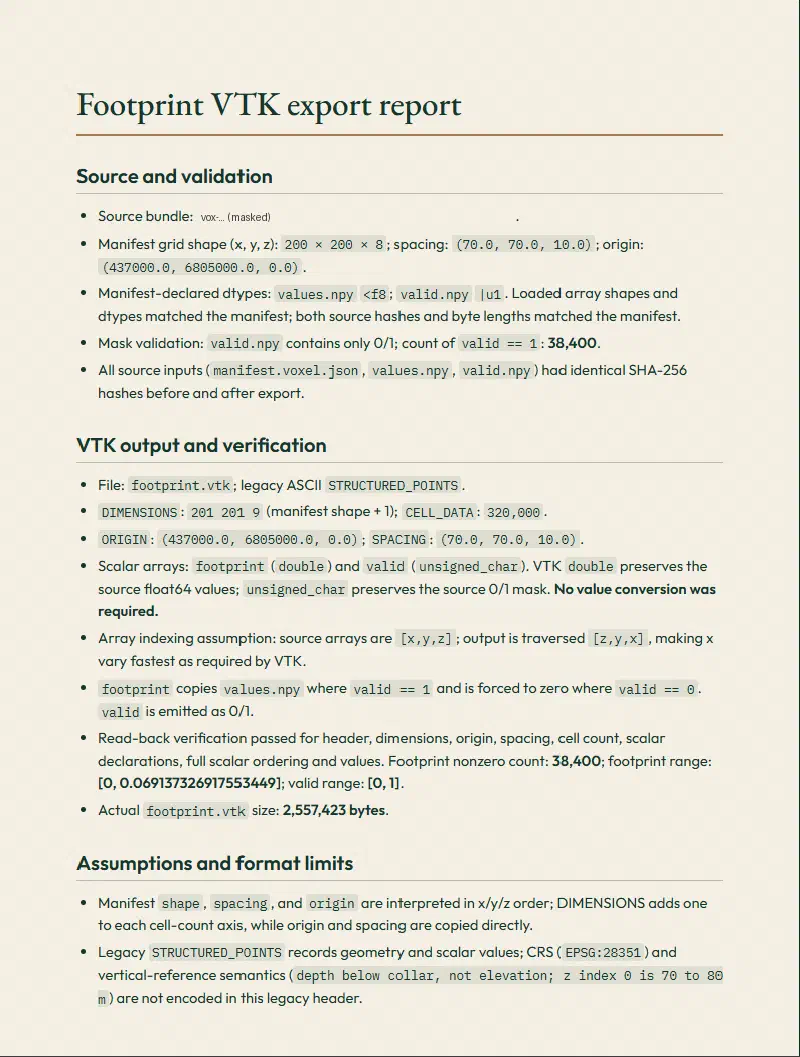
Use the uploaded folder @<voxel folder> (manifest.voxel.json, values.npy, valid.npy). Report the grid shape, spacing, origin and array dtypes from the manifest, and how many cells have valid = 1. Then write a legacy ASCII VTK file of type STRUCTURED_POINTS for ParaView. Use DIMENSIONS shape + 1 on each axis, ORIGIN and SPACING from the manifest, and CELL_DATA arrays named footprint (the values, 0 where valid = 0) and valid (0 or 1). The arrays are indexed [x, y, z]; VTK needs x varying fastest, so write them in [z, y, x] order. Save it as footprint.vtk and a short Markdown report with the file size, number of cells, number of non-zero cells, value range and every assumption. Do not change the uploaded files.The agent read the manifest (shape 200 x 200 x 8, spacing 70 x 70 x 10 m, origin 437000, 6805000, 0), counted 38,400 valid cells and saved footprint.vtk in the run’s results folder, together with its report. The file has DIMENSIONS 201 201 9, 320,000 cells and the cell arrays footprint and valid. It is 2,557,423 bytes. The agent also noted that the legacy VTK header cannot hold the CRS or the depth-below-collar meaning of z.
We checked the file ourselves. Reading it back gave 38,400 non-zero footprint cells, a range of 0.0012357 to 0.0691373, and a cell-by-cell match with the indexed table that built the voxel. Z index 0 is the deepest level, 70 to 80 m below the collar, and z grows upward. The origin z of 0 is the base of the grid, not an elevation. Empty cells carry valid = 0.
Step 3: Open Voxel Model in ParaView and Hide Empty Cells
Download footprint.vtk from the results folder. To open the voxel model in ParaView, choose File, Open, select the file and click Apply. If the grid is out of view, click Reset Camera. Before any filter, the empty cells are still in the dataset, so the whole 200 x 200 x 8 block is drawn. ParaView opens it in Solid Color and looks down the z axis, so at first you see a plain grey square. Drag the view to turn the block and see its thickness.
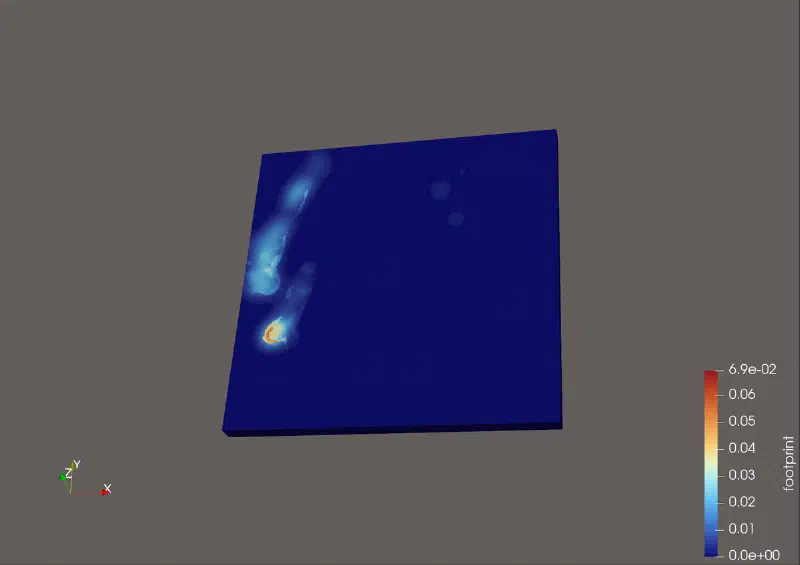
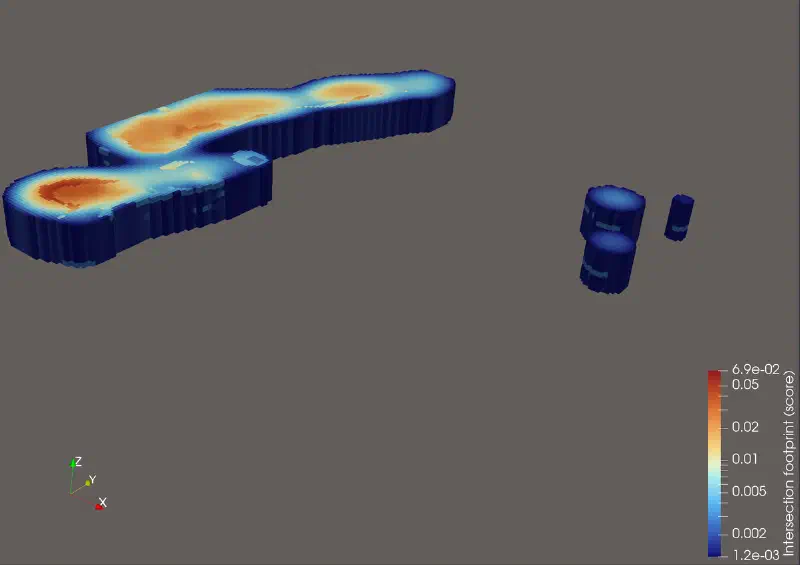
To hide the empty cells, choose Filters, Common, Threshold. Under Scalars choose the cell data valid, leave Threshold Method on Between, set Lower Threshold and Upper Threshold to 1 and click Apply. This is the threshold filter on cell data that leaves only the 38,400 valid cells. The Information tab of the filter confirms it: 38,400 cells, with valid from 1 to 1.
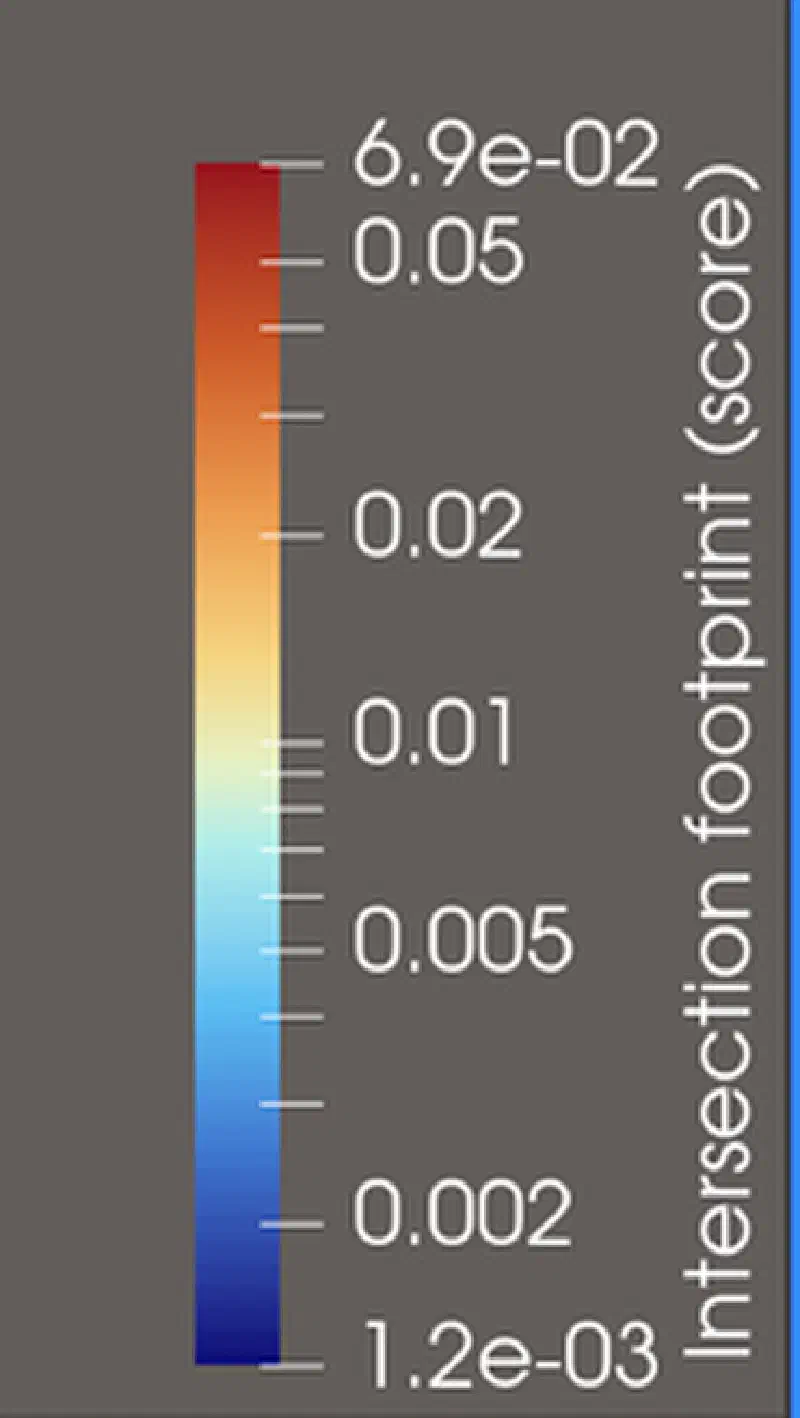
Then colour by footprint. The values are skewed, so use a logarithmic colour scale. Set the colour bar title to “Intersection footprint (score)”.
Step 4: Scale Z by 10 (Optional)
The grid is 14,000 m wide in both horizontal directions but only 80 m deep, so at true scale it looks like a thin sheet. To view the block model in ParaView as in the Geocluster viewer, scale Z by 10. Click the gear icon next to the search box in the Properties panel to show advanced settings, then open Display, Transforming and set Scale to 1, 1, 10. Widen the panel if the third box is cut off. The Transform filter does the same. This is a display choice only and changes no value.
Optional: Convert the ZIP Locally With Our Script
If the agent cannot save the file, you can convert the ZIP on your own computer. This script is ours, not a Geocluster feature. It checks the checksum of each array and writes the same kind of legacy VTK file. To convert a NumPy array to VTK cell data this way, save it as zip_to_vtk.py:
"""Convert a Geocluster voxel ZIP (manifest.voxel.json, values.npy, valid.npy, optional counts.npy)
to a legacy ASCII VTK STRUCTURED_POINTS file that ParaView opens.

Usage: python3 -I zip_to_vtk.py <voxel.zip> <out.vtk> [array name, default "value"]

Cell arrays written: <name>, valid, and source_count when counts.npy exists.
Empty cells have valid = 0 and a value of 0: hide them with a Threshold on valid, do not read 0 as data.
This is our own conversion, not a Geocluster export. ParaView does not read a CRS from the file.
"""
import hashlib
import io
import json
import sys
import zipfile

import numpy as np

zip_path, out_path = sys.argv[1], sys.argv[2]
name = sys.argv[3] if len(sys.argv) > 3 else "value"

with zipfile.ZipFile(zip_path) as z:
    manifest = json.loads(z.read("manifest.voxel.json"))
    arrays = {}
    for rec in manifest["arrays"]:
        data = z.read(rec["role"] + ".npy")
        if hashlib.sha256(data).hexdigest() != rec["sha256"]:
            raise ValueError(f"Checksum mismatch for {rec['role']}.npy")
        arrays[rec["role"]] = np.load(io.BytesIO(data), allow_pickle=False)

grid = manifest["grid"]
shape = tuple(grid["shape"])
if grid.get("order") != "C-z-fastest":
    raise ValueError(f"Unexpected array order {grid.get('order')}")
for role in ("values", "valid"):
    if arrays[role].shape != shape:
        raise ValueError(f"{role}.npy shape {arrays[role].shape} does not match the manifest {shape}")

# Arrays are indexed [x, y, z]; VTK wants x varying fastest, so write them as [z, y, x].
cols = {name: np.where(arrays["valid"].astype(bool), arrays["values"], 0.0), "valid": arrays["valid"].astype(int)}
if "counts" in arrays:
    cols["source_count"] = arrays["counts"].astype(int)

nx, ny, nz = shape
with open(out_path, "w") as f:
    f.write("# vtk DataFile Version 3.0\n")
    f.write(f"Geocluster voxel {manifest['field']['name']}; empty cells have valid=0\nASCII\nDATASET STRUCTURED_POINTS\n")
    f.write(f"DIMENSIONS {nx + 1} {ny + 1} {nz + 1}\n")
    f.write("ORIGIN {} {} {}\n".format(*grid["origin"]))
    f.write("SPACING {} {} {}\n".format(*grid["spacing"]))
    f.write(f"CELL_DATA {nx * ny * nz}\n")
    for key, a in cols.items():
        kind = "int" if a.dtype.kind == "i" else "double"
        f.write(f"SCALARS {key} {kind} 1\nLOOKUP_TABLE default\n")
        flat = np.transpose(a, (2, 1, 0)).ravel()
        for i in range(0, flat.size, 12):
            f.write(" ".join(repr(float(v)) if kind == "double" else str(int(v)) for v in flat[i:i + 12]) + "\n")

v = arrays["values"][arrays["valid"].astype(bool)]
print(f"{out_path}: grid {shape}, origin {grid['origin']}, spacing {grid['spacing']}, "
      f"valid cells {int(arrays['valid'].sum())}, value range {v.min():.6g} to {v.max():.6g}")
Run it with the ZIP, the output name and the array name footprint:
python3 -I zip_to_vtk.py <voxel.zip> footprint.vtk footprintThe script prints one summary line with the grid shape, origin, spacing, valid cell count and value range. It also writes a source_count array when the ZIP contains counts.npy, which this ZIP does not.
Limits of Opening a Voxel Model in ParaView
- Geocluster has no VTK export button. The file comes from the agent on request or from our script.
- The agent has to find the files first: the downloaded ZIP is not in the workspace until you upload it.
- The VTK file holds origin and spacing but no CRS. Keep EPSG:28351 with your notes.
- The vertical axis is depth below collar. Z index 0 is the deepest level, and the origin z of 0 is the base of the grid.
- The voxel is a display construction from public drilling data, not a resource or prospectivity model.
- Empty cells are written as
valid = 0andfootprint = 0. Colour ranges taken before the Threshold include those zeros.
FAQs
Does Geocluster Export Voxel Models to ParaView?
Geocluster has no VTK or ParaView export button, but its agent can write a legacy VTK file from your voxel files when you ask. In our run it saved footprint.vtk and a report. You can also convert the ZIP yourself with the Python script in this guide.
Why Could the Agent Not Find My Downloaded Voxel ZIP?
The ZIP you download from Create voxel goes to your computer, not to the project workspace, so the agent has nothing to read. Upload the ZIP with Upload files. Geocluster extracts it into a folder with the manifest and two arrays, and you can attach that folder to your prompt.
Why Does the Voxel Look Like a Solid Block at First?
ParaView draws every cell in the 200 x 200 x 8 grid, including the 281,600 empty ones. Because the file stores empty cells with valid = 0, a Threshold filter on the cell array valid with both limits set to 1 hides them and leaves 38,400 cells.
Does ParaView Read EPSG:28351 From the VTK File?
No, ParaView does not read a coordinate reference system from this file. The file stores the origin (437000, 6805000, 0) and the cell spacing (70, 70, 10) in metres, so you need to keep track of EPSG:28351 yourself when you combine it with other layers.
What Does the Z Axis Mean in This Voxel?
The z axis is depth below the drill hole collar, not elevation. Index 0 is the deepest level, 70 to 80 m below the collar, and z grows upward. The origin z of 0 marks the base of the grid, so it must not be read as a height above sea level.
What Unit Goes on the Colour Bar?
Use “Intersection footprint (score)”. The values have no unit, so ppm would be wrong. They are a smoothed screening score built from high-grade gold intersections, target lithology and alteration, not an assay grade, and they range here from 0.0012357 to 0.0691373.
Open a Voxel Model in ParaView With Geocluster
Asking the Geocluster agent for a VTK file gives a repeatable way to inspect a 3D grid in ParaView with its threshold and transform filters. To build your own grid from drilling tables, start in Geocluster.