Key Takeaways
- A geologic map shows which rocks lie where. Artificial intelligence in geology can look up what is already known about the area it covers, such as past earthquakes, faults (cracks in the Earth’s crust that can still move) and mineral finds. This step puts each result on the map, like dropping pins on an online map, so a person can see where it is instead of reading latitude and longitude numbers.
- It makes two pictures. One is a simple chart of the area with every result marked in colour. The other, when the scanned map is available, shows the same results drawn on the map itself.
- If a result lands outside the map, the program hides it and warns you. That often means the map’s position on Earth was set slightly wrong, but not always.
TL;DR
A long list of latitude and longitude numbers is hard to check by eye. This tool takes what a geology search found, such as earthquakes and faults, and puts each one on the map in its own colour, like pins on an online map. It also warns you when something lands outside the map.
What Is geomap_render_knowledge_overlay?
geomap_render_knowledge_overlay is the plotting tool in Stratigraphic Amenity, Eigenform’s open-source (MIT) MCP server for scanned geologic maps. It takes exactly one knowledge bundle, as a bundle_uri from an earlier lookup or inline. It then turns that bundle into pictures an agent or user can open.
The bundle usually comes from looking up earthquakes, faults and minerals for a bounding box, or from a question about a scanned map.
The tool also needs a georeference, the link between the map and real coordinates. It reads one passed inline as georef, or the stored one of a registered map given by map_id or map_uri. With neither, the call fails with georef_required, so georeferencing the map comes first.
What Does the Overlay Show?
Each call can produce two images, and both carry the same records.
The SVG: a chart of the area
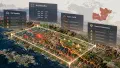
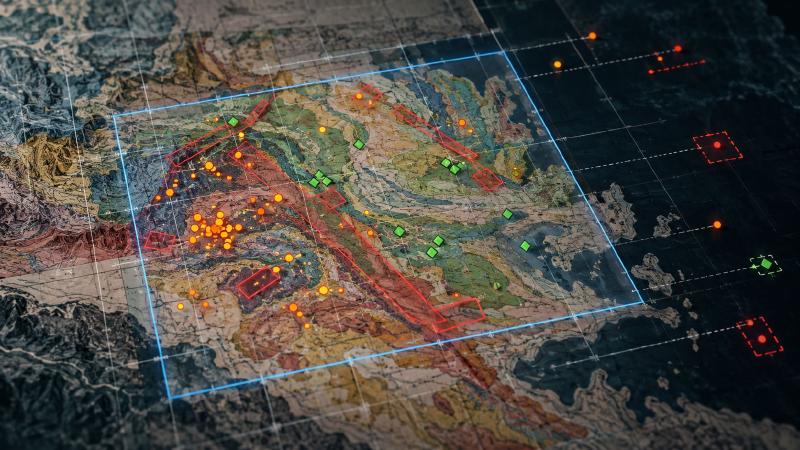
The tool always writes an SVG. It draws the query box in blue and each provider’s lookup box as a grey outline. Faults appear in red, earthquakes in orange and mineral occurrences in green. Every record carries its name or place, and a grid shows longitude and latitude.
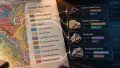
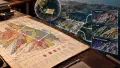
With a registered map, the scan itself, cropped to its main map panel, sits faintly behind the chart. That makes artificial intelligence in geology results easy to compare with the mapped geology underneath.
Faults appear as boxes, not lines. The tool draws each fault’s bounding box, so a long diagonal fault can cover far more of the chart than the fault itself.
The PNG: records drawn on the scan
With a registered map, the tool also draws the records straight onto the scanned image. It converts each point to a pixel through the georeference, adds a legend with a count per provider, and assumes north is up.
This step needs OpenCV, which comes with the server’s detectors extra. Without it, the result warns “annotated PNG unavailable” and still returns the SVG. The PNG also comes back as an inline preview, a shrunken copy with its own coordinate frame. An agent should never measure positions on it.
Each call writes new files
The tool is not idempotent. Every call writes a new SVG, and a PNG where possible, under new geomap://overlays/<id> addresses. The summary reads “Rendered knowledge overlay with N annotation item(s).”
Out-of-Bounds Annotations and CRS Mismatch
A point must fall inside the query box. A fault box only needs to overlap it, so a fault crossing the edge of the map still shows. The tool hides anything else and lists it under out_of_bounds. A warning then says “N knowledge annotation(s) fell outside the target map bounds… This usually indicates a coordinate or CRS misalignment in the lookup.” The SVG repeats it in red.
A CRS mismatch means someone read the coordinates in the wrong coordinate system, for example map grid numbers taken as the wrong UTM zone. The records then land somewhere other than the map, the kind of error artificial intelligence in geology tools should surface rather than hide.
Not every hidden point is an error, though. The earthquake lookup deliberately reaches 0.05°, about 5.5 km, beyond the box. A quake just past the edge therefore disappears from the picture and raises the same warning. Before calling the georeference wrong, check how far outside the hidden points lie.
FAQs
What files does geomap_render_knowledge_overlay create?
It always writes an SVG chart of the area. With a registered map and OpenCV installed, it also writes a PNG of the records drawn on the scanned map and returns a preview of it. Both are geomap://overlays/<id> resources, and every call creates new ones.
Why is there no annotated PNG?
Either the call had no registered map, because inline georeferencing alone only produces the SVG, or OpenCV is missing. In the second case the result carries a warning, “annotated PNG unavailable”, and the SVG still arrives. Ask the server operator to install the detectors extra to get the PNG.
What does “fell outside the target map bounds” mean?
Some records landed outside the query box, and the tool hid them. Often someone used the wrong coordinate system when georeferencing the map or setting the box. It can also be harmless: earthquake results reach about 5.5 km past the box by design, so check the hidden points first.
Are faults drawn as lines?
No. The overlay draws each fault as its bounding box, the smallest rectangle around the fault, taken from the lookup’s geometry_bbox field. A long fault running diagonally gives a large box, so read the fault records themselves before judging how close a fault passes to a target.
Try It With Geocluster
Stratigraphic Amenity is one of the Geocluster tools, MCP servers that let AI agents work with geology data and maps.
The overlay is also a quick check on questions about a scanned map. If the records land where the map says they should, the georeference is probably right.