Key Takeaways
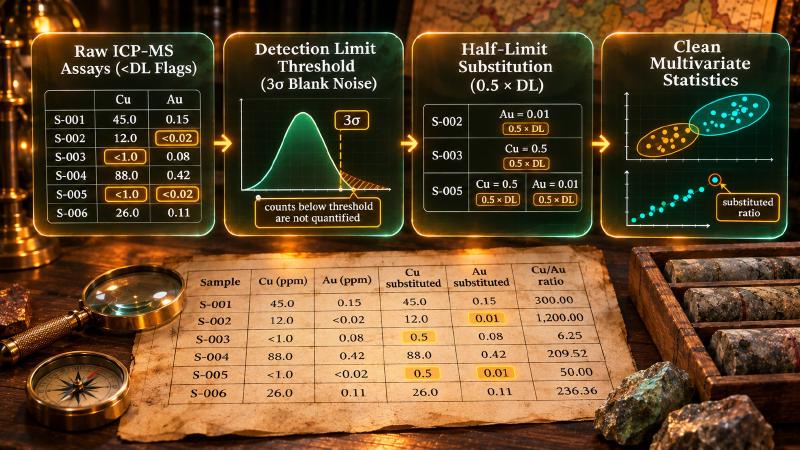
- The task today: Geologists search for detection limit handling in geochemical assays to interpret laboratory rock samples, and GeoCluster, a browser-based AI agent for geological investigation, treats below-detection values as half the limit while keeping original test records safe.
- The problem: Chemical measurement devices cannot reliably tell tiny amounts of metals apart from background instrument noise, producing entries below the detection limit that cause computer programs to fail or generate false exploration anomalies if replaced carelessly.
- What the tool does: Exploration software replaces below-detection values with half the detection limit so mathematical clustering can run, while storing raw laboratory certificates separately to ensure every computer prediction remains auditable against physical drill core.
TL;DR
When laboratory tests on rock samples return values below a detection limit, it means the chemical signal is too faint to measure accurately, not that the element is absent. Geologists commonly replace these unmeasured entries with half the detection limit so computer algorithms can calculate statistics without crashing on text symbols or zero values. However, because this numerical shortcut can distort metal ratios and create artificial exploration anomalies, trustworthy geology software must always keep original laboratory certificates separate from calculated numbers.
What is a detection limit in geochemistry?
In exploration geochemistry, a detection limit defines the lowest concentration of an element that an analytical instrument can reliably distinguish from background noise when measuring geochemical assays. Understanding the limit of detection geochemistry practitioners encounter on assay certificates is vital: values below this boundary represent left-censored data rather than true zero concentration.
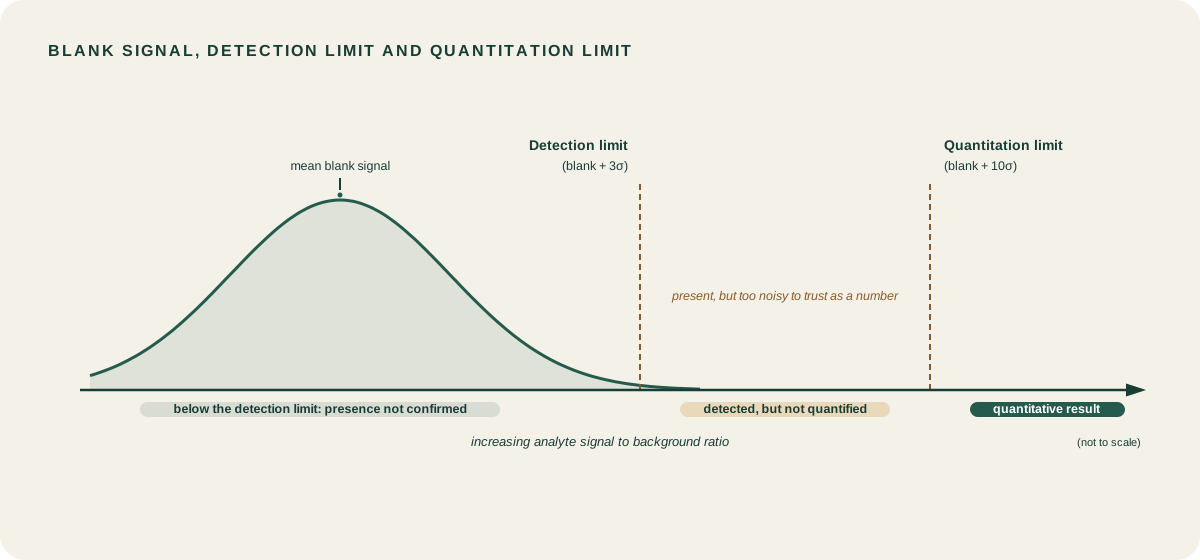
Laboratories establish this threshold from a method blank: the International Union of Pure and Applied Chemistry (IUPAC) defines it as the smallest concentration of analyte producing a signal significantly greater than the blank, conventionally three standard deviations (3σ) above the mean blank signal.
Detection limit, quantitation limit and reporting limit: what is the difference?
Analytical reports use related terms describing different levels of measurement certainty.
| Measurement Threshold | Mathematical Definition | Typical Uncertainty (RSD) | Practical Role on Assay Certificates |
|---|---|---|---|
| Limit of Detection (LOD / LLD) | Mean blank signal plus 3σ | High relative uncertainty | Confirms analyte presence with 99.87% confidence against blank noise; values lack quantitative precision. |
| Limit of Quantitation (LOQ) | Mean blank signal plus 10σ | Low relative uncertainty | Threshold recommended by the ACS Committee on Environmental Analytical Chemistry for reliable numerical reporting. |
| Practical Reporting Limit | Stated laboratory lower limit | Varies by sample matrix | Commercial cutoff published on laboratory schedules; routine exploration matrices often elevate practical limits above optimal baselines. |
Grimstvedt demonstrated in the Geological Survey of Norway (NGU) Bulletin 427 that evaluating replicate blanks establishes the baseline lower limit of detection, while reported limits from commercial laboratories reflect optimal conditions using clean standards. In routine geochemical analysis, practical detection limits are often higher due to sample matrix complexity.
Why geochemical assays fall below the detection limit
Exploration samples return below-detection entries across multi-element packages for three primary reasons:
- Natural Crustal Abundance: Background levels of precious metals and volatile pathfinders in unmineralized country rock are minute: gold, platinum, bismuth, and antimony regularly occur in baseline rocks at single-digit parts per billion, far beneath standard exploration multi-element packages.
- Analytical Method Selection: Every technique and finish has its own detection limit: a field-portable X-ray fluorescence (pXRF) analyzer cannot see gold at the low concentrations that fire assay, the standard finish for gold, resolves, and an inductively coupled plasma mass spectrometry (ICP-MS) finish after four-acid digestion reaches lower limits for base metals than pXRF. The DL that matters for any element is the one printed on the laboratory report for the method actually used.
- Matrix Interferences: High iron, titanium, or sulfur concentrations produce spectral interferences that often force laboratories to dilute digested solutions, raising effective detection thresholds for that batch.
How to handle assays below detection limit before analysis
Exploration geologists evaluate several options when managing values below detection limit:
| Handling Method | Mathematical Treatment | Common Application | Statistical Distortions and Trade-offs |
|---|---|---|---|
| Complete-Case Deletion | Exclude every sample containing a <DL value | Quick scatter plots of high-grade ore zones | Introduces severe positive bias; discards unmineralized background samples and distorts spatial populations. |
| Zero Substitution | Replace <DL strings with 0.0 | Preliminary spatial mapping | Generates severe bimodal spikes at zero; prevents logarithmic transformations and distorts correlation matrices. |
| Half-Limit Substitution | Replace <DL with 0.5 × DL | Routine exploration and commercial software | Shifts population means downward; artificially suppresses variance and distorts elemental ratios when the censored share is substantial. |
| Statistical Regression (ROS / MLE) | Estimate distribution using order statistics or maximum likelihood | Environmental baselines and single-element audits | Requires rigorous distributional assumptions; difficult to implement across multi-element exploration suites. |
| Compositional Log-Ratio Methods | Impute censored components using compositional covariance | Research-grade compositional data analysis | Preserves relative covariance geometry; mathematically complex to configure across variable detection limits. |
Why many geologists use half the detection limit
Despite known statistical limitations, substituting half detection limit remains common practice across the mineral exploration industry.
For example, Seequent’s Oasis montaj documentation for assay attributes explicitly specifies that values below the minimum detection limit are normally set to one-half the detection limit, and that principal component analysis applies this substitution to avoid the logarithm of zero.
Automated workflows powered by a geology AI agent apply this deterministic half-limit substitution while keeping the substituted analysis matrix separate from original laboratory values.
Compositional log-ratio alternatives for censored data
Research from the Universitat de Girona compositional data analysis group explores log-ratio methods for replacing values below detection limits. These algorithms treat multi-element assays as closed compositional data: element proportions sum to a constant total.
Log-ratio imputation estimates replacement values that preserve the relative variance and covariance structure of the detected elements, preventing the artificial correlation spikes that a single constant fraction introduces.
A worked example with a small assay table
Compare six rock chip samples analyzed for copper (Cu, detection limit 1.0 ppm) and gold (Au, detection limit 0.02 ppm). The assay numbers are invented for demonstration purposes:
| Sample ID | Measured Cu (ppm) | Measured Au (ppm) | Substituted Cu (0.5 × DL) | Substituted Au (0.5 × DL) | Substituted Cu/Au Ratio |
|---|---|---|---|---|---|
| S-001 | 45.0 | 0.15 | 45.0 | 0.15 | 300.00 |
| S-002 | 12.0 | <0.02 | 12.0 | 0.01 | 1200.00 |
| S-003 | <1.0 | 0.08 | 0.5 | 0.08 | 6.25 |
| S-004 | 88.0 | 0.42 | 88.0 | 0.42 | 209.52 |
| S-005 | <1.0 | <0.02 | 0.5 | 0.01 | 50.00 |
| S-006 | 26.0 | 0.11 | 26.0 | 0.11 | 236.36 |
This substitution produces two measurable shifts:
- Shift in Population Means: The uncensored-row mean copper grade across four samples is 42.75 ppm, and the mean gold grade is 0.190 ppm. With half-limit substitution (0.5 ppm Cu, 0.01 ppm Au), the mean copper grade drops to 28.67 ppm, and the mean gold grade falls to 0.130 ppm. The substitution pulls the population mean downward.
- Severe Ratio Distortions: The mean Cu/Au ratio across S-001, S-004, and S-006, where both metals were quantified, is 248.63. Substituting gold at 0.01 ppm in S-002 creates an artificial ratio of 1200.00, and substituting copper at 0.5 ppm in S-003 creates a ratio of 6.25. The mean substituted ratio across all six samples jumps to 333.69: a single substituted denominator can create an artificial anomaly that skews target selection.
Check assays before clustering or geochemical anomaly detection
Before running clustering or pathfinder anomaly detection, geologists must audit the proportion of censored values across their assay data.
When only a small share of an element’s values is censored, half-limit substitution provides a practical, defensible input for multivariate algorithms. When the censored share grows large, the substitution parks many samples on the same constant value and creates artificial statistical clusters around it; analysts should then exclude that element from dimensionality reduction or apply specialized censored data methods.
In addition, GeoCluster enforces this analytical discipline by treating below-detection assays as half the limit in computational routines while preserving full evidence traceability.
FAQs
What is a detection limit?
A detection limit is the lowest concentration of an analyte that a laboratory analytical instrument can reliably differentiate from background noise. Defined at three standard deviations above the mean method blank signal, it confirms an element is present in a sample without providing quantitative precision.
What does below detection limit mean in an assay report?
A below detection limit entry, often written as <0.5 or <DL, means the element concentration is lower than the laboratory instrument can distinguish from background noise. It indicates left-censored data rather than zero concentration, meaning the element may be present in trace amounts.
Is an assay value below the detection limit zero?
No, an assay value below the detection limit is not zero. It represents an unknown value between zero and the stated detection threshold. Treating censored assays as zero introduces severe downward bias, alters population distributions, and prevents standard logarithmic transformations.
Why do geologists replace values with half the detection limit?
Geologists replace censored assays with half the detection limit because statistical packages cannot process text strings like <0.5. The substitution provides a simple, positive numerical proxy that prevents algorithms from calculating the logarithm of zero or negative numbers.
What is the difference between detection limit and quantitation limit?
The limit of detection is typically defined at three standard deviations above the blank signal, confirming presence with relatively high uncertainty. The limit of quantitation is set at ten standard deviations above the blank, where numerical results achieve acceptable quantitative precision.
Can too many below-detection values affect geochemical clustering or PCA?
Yes, high censoring proportions distort principal component analysis and clustering. Substituting a constant value for many samples produces artificial clusters, compresses variance, and creates spurious correlation spikes. If a large share of the samples is censored, analysts should evaluate alternative statistical treatments or exclude the element.
How do databases record values below the detection limit?
Geological databases store below-detection assays by retaining the qualified text string or using a dedicated numeric value paired with a metadata flag. When digitizing historical exploration records, automated PDF table extraction tools preserve qualifier characters and detection limit headers rather than truncating raw text cells into bare numbers.
Try It With Geocluster
The geochemical clustering and anomaly tools in GeoCluster are built for exactly this audit: a browser-based AI agent for geological investigation applies the substitution rules above to the assay table you load, in open-source or Enterprise form.
To evaluate below-detection thresholds directly in your browser, explore geochemical data analysis software that keeps physical laboratory measurements traceable.
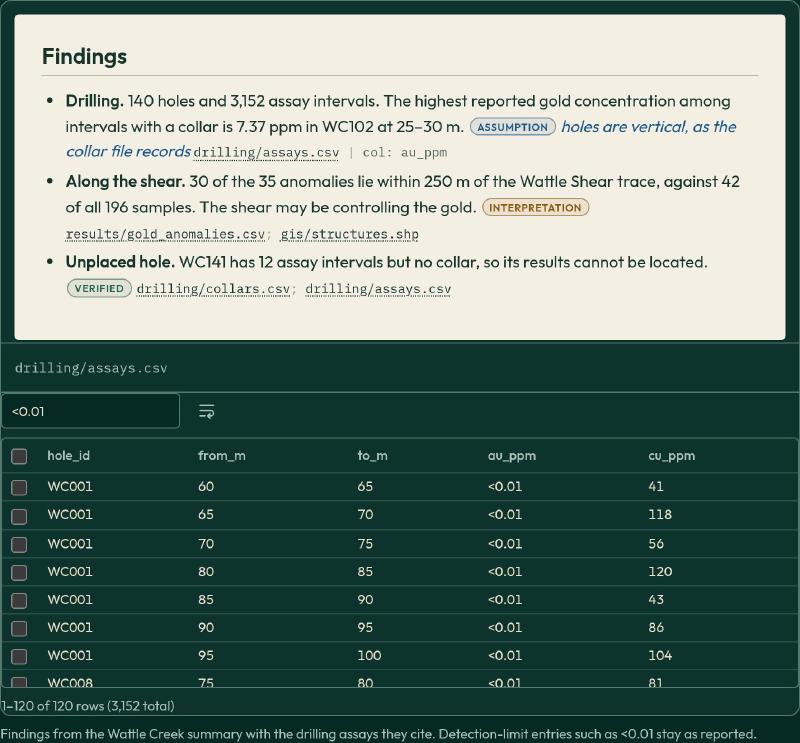
Exploration teams can also review how commercial platforms structure drillhole data in our evaluation of best geological data analysis software across the exploration workflow.