Key Takeaways
- Pass@k gives a model k independent tries at each problem and counts the problem solved if any one try passes the tests. The score is the share of problems solved that way. Estimate it by drawing more than k samples and using the unbiased formula from the HumanEval paper. Extrapolating from a measured single-try rate, as if each try were a coin flip, undercounts it.
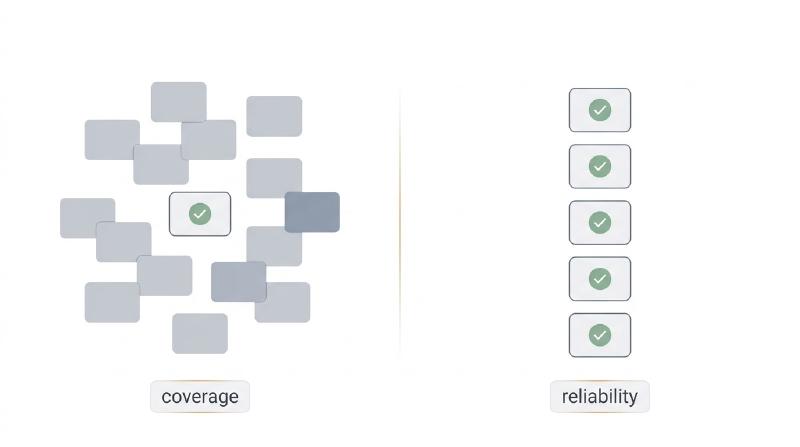
- Pass@k at large k measures coverage: whether a correct answer exists somewhere among the tries, not whether you can find it. Unless tests or another checker pick the winner, pass@100 is the ceiling of a system you cannot build, not an accuracy you can ship.
- The same score can hide three different problems. The tests may be too weak to catch wrong code: the stricter HumanEval+ suite cut scores by up to 28.9 per cent. The model may get lucky once and fail to repeat it: pass^k, the chance that all k tries pass, falls fast as k grows. And a retry that reads the previous error message is not an independent try, so the formula no longer applies.
- A self-training loop needs four numbers, not one: success on a single deterministic try, coverage at large k, pass^k, and task completion under the retry budget the system really gets. Each answers a different question. Any one of them alone misleads.
TL;DR
Pass@k reports the fraction of problems for which at least one of k samples passes the tests, and the Codex estimator makes that number unbiased for any k up to the sample count. It says nothing about which sample you would have picked, how often a single run succeeds, or whether the tests are strong enough to reject wrong code. Pair it with greedy pass@1, pass^k and a harder test suite before drawing conclusions about a model or a self-training loop.
What Pass@k Measures and How to Estimate It
Pass@k asks a narrow question: if you draw k samples from the model for one problem, does at least one of them pass the unit tests? The fraction of problems where the answer is yes is the score. Chen et al. (2021) made it the standard for code generation when they introduced HumanEval, 164 hand-written Python problems with an average of 7.7 tests each, and they trace the framing to Kulal et al. (2019), who used it to score pseudocode-to-code search.
The naive route is to measure a per-problem success rate p from a few samples and report 1 minus (1-p)^k. Chen et al. show that this is a consistent underestimate, and that the gap does not close even when n exceeds 5k. Their fix is to draw n samples, count the c that pass, and compute the probability that k draws without replacement contain at least one success: 1 minus C(n-c, k)/C(n, k). The estimator is unbiased for every k up to n, which is what lets a pass@100 computed from 200 samples be compared across models. The reference implementation in openai/human-eval returns a per-problem array rather than one number, and the pass^k variant below reuses the same n and c.
import numpy as np
from math import comb

def pass_at_k(n: int, c: int, k: int) -> float:
    """Unbiased coverage estimate: n samples drawn, c correct, budget k."""
    if n - c < k:
        return 1.0
    return 1.0 - float(np.prod(1.0 - k / np.arange(n - c + 1, n + 1)))

def pass_pow_k(n: int, c: int, k: int) -> float:
    """Reliability: probability that k draws without replacement all pass."""
    if c < k:
        return 0.0
    return comb(c, k) / comb(n, k)

def aggregate(results: dict[str, list[bool]], k: int) -> tuple[float, float]:
    """results maps a task id to the pass/fail outcome of each sample."""
    cov = [pass_at_k(len(r), sum(r), k) for r in results.values()]
    rel = [pass_pow_k(len(r), sum(r), k) for r in results.values()]
    return float(np.mean(cov)), float(np.mean(rel))
Coverage Is Not Accuracy
Scaling k shows what the metric is really measuring. Brown et al. (2024) sampled up to 10,000 completions per problem and found that coverage, the share of problems with at least one correct sample, grows roughly log-linearly with the number of samples across four orders of magnitude. On SWE-bench Lite, DeepSeek-Coder-V2-Instruct resolved 15.9 per cent of issues with one sample and 56 per cent with 250, above the single-sample state of the art at the time.
The same paper shows the catch. When a problem has an automatic verifier, unit tests or a proof checker, coverage converts directly into solved problems because the verifier picks the right sample. When it does not, majority voting and reward models plateau beyond a few hundred samples while coverage keeps climbing. Pass@k at large k therefore measures what a verifier-equipped system could extract from the model, not what any user sees. Reporting it as accuracy is a category error, and reporting pass@1 for a system that runs the tests before answering is the opposite one.
Weak Tests Inflate Every k
A pass@k score is only as strong as the tests behind it. Liu et al. (2023) extended HumanEval’s test suites by 80 times with automatically generated inputs to build HumanEval+, then re-evaluated 26 models. Scores fell by up to 19.3 to 28.9 per cent depending on k, and the rankings moved: two open models that had trailed ChatGPT on HumanEval overtook it on HumanEval+. The original tests were letting wrong programs through, and the more samples you drew, the more of those wrong programs found a gap.
That last point is specific to k. Each extra sample is another chance to hit a program that happens to satisfy a weak test suite, which is why the reduction Liu et al. report grows from 19.3 per cent at k=1 to 28.9 per cent at k=100. Coverage at large k is the most test-sensitive number in the family. Before trusting it, make the tests harder, or at least report how many tests each problem carries.
Pass^k: The Reliability the Family Leaves Out
Pass@k rewards one lucky draw. Yao et al. (2024) introduced the complementary metric pass^k in τ-bench: the probability that all k independent trials of a task succeed, averaged across tasks. For a deployed agent, a customer-service flow or a nightly repository job, this is the number that matters, because the user gets one run and the operator wants every run to work. On τ-bench’s retail domain, GPT-4o with function calling succeeded on a little over 60 per cent of tasks at k=1 and on under 25 per cent at pass^8.
| Metric | Question it answers | What it hides |
|---|---|---|
| Greedy pass@1 | How often does one deterministic run succeed? | Capability the model reaches only with more samples |
| Coverage at k from 10 to 1,000 | How many problems can any of k samples solve? | Which sample to pick, reliability, weak tests |
| pass^k | How often do k independent runs all succeed? | Rare capabilities the model has but cannot repeat |
| Completion with k retries and feedback | What does the harness deliver under its budget? | Comparability: attempts are dependent, so it is not a sampling estimate |
Training Loops Move pass@1 and pass@256 in Opposite Directions
The metric family also exposes what a training objective did. Yue et al. (2025) compared base models with versions of them trained by RLVR (Reinforcement Learning with Verifiable Rewards) across k. The trained models win at k=1, the base models catch up as k grows and score higher at k=256, and the crossover moves earlier the longer RLVR runs. Their reading is that RLVR concentrates probability on paths the base model could already produce: higher sampling efficiency, a narrower boundary. Whether that holds for larger models and longer training is contested, but the measurement is the point: pass@1 and pass@256 answer different questions, and a method can raise one while lowering the other.
Objectives can target a chosen k directly. Walder and Karkhanis (2025) transform the rewards of a group of n samples so that the policy gradient optimises the k-sample objective for any k up to n, with unbiased, low-variance estimators of the metric and its gradient. Training for a large k keeps the group diverse, since one correct sample suffices, and it trades some pass@1 to get there. Where a reliable checker exists, GRPO (Group-Relative Policy Optimisation) and these k-sample variants remain the stronger default, and the choice of k is a design decision about whether you ship a single answer or a search.
Agent harnesses add a dimension that none of the sampling metrics covers. When an agent may retry after reading a traceback, its attempts are not independent draws, so pass@3 under that harness is not an estimate of anything the Codex estimator defines. Under such a budget, a loop that trains on its own successful trajectories can push first-attempt success down while task completion rises, because a cheap failing probe that returns an informative error becomes a rational first move, an emergent exploration strategy that no reward term asked for and that a self-training coding loop produced once retries were free. The metric did not break. It measured a quantity the harness no longer optimised.
When we tested this in Survival is the Only Reward. Eigenform’s Terese lineage went from a pass@1 of 55 percent at its third version to zero from the sixth version onward, while the share of its code blocks that compiled and ran rose from 21 percent at the first version to between 83 and 94 percent over the last five; the Katalin lineage reached zero pass@1 at the same point. The agents had learned to spend the first attempt on a probe and to treat the traceback as information, with no instruction, scratchpad or reward term for exploration. HumanEval pass@1 moved by only a few points over the same versions, so the drop measured a change of strategy rather than a loss of coding skill, which is why the paper removed code accuracy from its composite score.
So the evaluation plan for any loop that trains on its own outputs, RL (Reinforcement Learning) or SFT (Supervised Fine-Tuning) on filtered successes, needs four numbers rather than one. Greedy pass@1 on held-out tasks measures sampling efficiency. Coverage at k of 64 or more on the same tasks measures whether the capability boundary moved, which is the question Yue et al. asked. Pass^k measures whether the agent can repeat what it did. Completion under the production retry budget measures what the harness delivers, and it is the only one of the four a user experiences. When a training round moves them in different directions, that is information about the objective, not a measurement error.
FAQs
Is pass@1 the same as accuracy?
Only when it is computed greedily, with one deterministic sample per problem, and the tests are sound. A pass@1 estimated from n sampled completions at temperature 0.8 is the expected per-sample success rate, a different and usually lower quantity. State the decoding settings and the sample count beside every score you publish.
Why count at least one of k samples rather than the best one?
Because the metric was designed to ask whether a correct program exists in the model’s distribution, which is the question a search procedure with a verifier cares about. Choosing the best sample without a verifier is a separate problem, and ranking by majority vote or a reward model plateaus well before coverage does.
How many samples do I need for a stable estimate at k=100?
The estimator is unbiased for any n of at least k, but its variance shrinks as n grows, and at n=k each problem contributes a single binary draw. Chen et al. drew 200 samples per problem to estimate pass@100. A practical rule is n of at least twice k, with the same n for every model you compare.
Should a self-training loop be judged on pass@1 or on completion with retries?
On what the harness will do in production. If users get one shot, train and evaluate on single-sample success. If the harness grants retries with execution feedback, train on completed trajectories and expect first-attempt metrics to drift, as they did in iterative SFT agent loops, while still reporting all four numbers.
Eigenform is a company building self-training open source models and frameworks. You can try them on GitHub.