
TL;DR
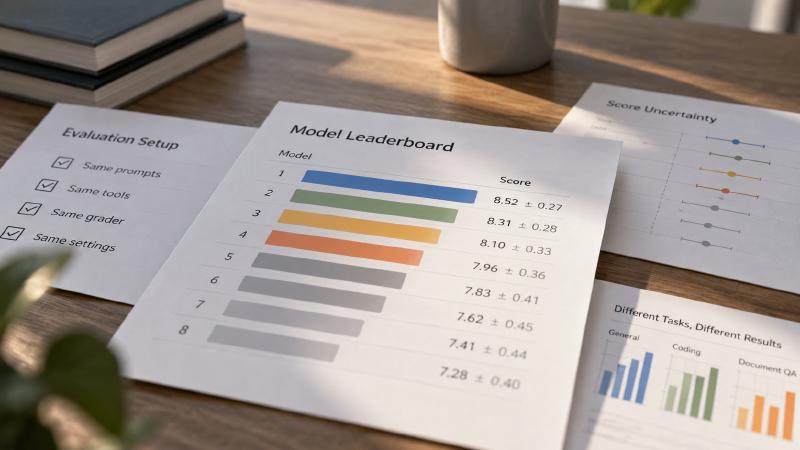
- An LLM benchmark leaderboard ranks AI language models (LLMs) by their scores on the same test, like a league table in sport. It is useful, but the order it shows is often less certain than it looks.
- Two models a few points apart may really be tied: a slightly different set of questions could have put them in the other order. The better leaderboards show a range for each score, not just a rank.
- Our examples come from Groundtruth, Eigenform’s open source dynamic benchmark, whose leaderboard puts eight AI models into groups of roughly equal performance instead of a strict first-to-last order.
Key Takeaways
- Most small gaps on a leaderboard are noise. Among eight models on our leaderboard, only 2 of 7 gaps between models ranked next to each other were big enough to be real.
- How a leaderboard is built matters more than its order. Some run every test themselves; others collect numbers the model makers report, which are harder to check.
- Coding and general leaderboards measure different things. A top place for fixing code says little about answering questions from documents.
- Every test has a limit on what it can tell apart. On our 50-question tests, gaps under 0.27 to 0.45 points out of 10 are too small to trust.
An LLM benchmark leaderboard is the quickest way to compare models and the easiest to misread. A table sorted to two decimal places looks precise; however, whether it is depends on how many questions sit behind it, who ran them, and what stayed the same between runs.
We run one for Groundtruth, Eigenform’s open source dynamic benchmark, which grades models on 150 questions drawn from exploration reports. So its numbers show what to check on any leaderboard, and the list below covers the main public ones.
What is an LLM benchmark leaderboard?
An LLM benchmark leaderboard is a table that ranks language models by their scores on a fixed set of tasks under fixed grading rules. Its value rests on three things: what the tasks test, what stays constant between models, and whether the gaps between neighbours are larger than the measurement’s own noise.
In practice, leaderboards differ most in where their numbers come from. Some run every evaluation themselves under one set of settings, some collect human votes, and others aggregate scores that model makers publish. As a result, an LLM model benchmark leaderboard built from provider-reported numbers is only as consistent as the providers’ own test setups.
How to read an LLM leaderboard: methodology and what’s controlled
For that reason, five questions separate a ranking you can use from one you can’t.
| Question | Why it matters | What our leaderboard does |
|---|---|---|
| Who ran the tests? | Numbers you can’t re-run are hard to check | Self-reported, with raw scores linked on every row |
| What was held constant? | Prompts, tools, graders and settings all move scores | One judge at temperature 0; a separate track pins the model |
| Are the gaps significant? | Small gaps are often noise | Tiers from 95% confidence intervals |
| Does the order hold on other data? | One test set can flatter some models | Three document sets, reported separately |
| Are conflicts disclosed? | A grader can favour its own model family | The judge’s family is on the board, and we say so |
Who ran the numbers
A score reported by the model’s maker and a score measured independently can differ widely. For example, when OpenAI announced o3, it cited more than 25% on the FrontierMath benchmark; Epoch AI’s own run of the released model scored around 10%, and the difference was put down to setup, compute or the problem subset, as TechCrunch reported.
Our Groundtruth leaderboard is also self-reported, and says so on the page. Each row is what a submitter’s own scoring run produced, with a link to the raw scores, and rows whose question IDs don’t match the rubric are flagged rather than hidden.
What was held constant
A score belongs to a model and everything around it: the prompt, the tools, the grader and the sampling settings. On our leaderboard, for instance, the same judge grades every answer at temperature 0, and a separate harness track pins one reference model so that agent setups can be compared on their own.
Even so, holding the setup fixed still leaves the models free to behave differently. With the same three tools over the same documents, Gemini 3.1 Pro Preview made 67% of its tool calls in the shell and GPT 5.6 Sol made 0.4%.
Whether the gaps are significant
This is the question most leaderboards skip. On ours, for example, Kimi K3 scored 8.81, with a 95% confidence interval of 8.66 to 8.97, and Claude Sonnet 5 scored 8.62, with an interval of 8.36 to 8.84. Because the intervals overlap, the benchmark cannot say which is better.
Across eight models and 1,200 graded answers, only 2 of 7 gaps between neighbouring models reached benchmark statistical significance. The honest reading is therefore three tiers: four models at the top, three in the middle and one below. With 50 questions per set, the smallest gap we could tell from noise was 0.27 points on WAMEX, 0.33 on USGS and 0.45 on Technical.
Still, some public boards do show uncertainty. Arena, which ranks models from human votes, prints each score with a ± range and a rank spread. Most others, however, print a single number.
Whether the order holds on other data
Similarly, a ranking on one test set can reverse on another. On our three document sets the top tier held, but the middle did not: Deepseek V4 Pro was the lowest of its group on Technical (7.34) and the highest of that group on WAMEX (8.46). With one set, either order would have looked like the answer.
Whether conflicts and contamination are disclosed
A leaderboard can be gamed without anyone faking a number. The Leaderboard Illusion, a 2025 study of Chatbot Arena, found that some providers tested many private model variants before release and published only the best, one of them 27 variants in a single month.
In addition, graders carry conflicts. Our judge comes from a model family that competes on the board, where GPT 5.6 Sol places third, so we disclose it next to the results. Publishing tiers and conflicts alongside scores is part of a reliable AI evaluation framework, not an optional extra.
LLM leaderboard categories
General-purpose leaderboards
General boards mix knowledge, reasoning and conversation. Arena ranks models from pairwise human votes, fitted into scores with confidence intervals. Artificial Analysis runs its own evaluations with fixed settings and combines them into an index that weights agentic, coding, general and scientific reasoning tasks.
LLM benchmark leaderboard: coding
Coding boards, by contrast, test whether a model, usually inside an agent, can write or fix working code. SWE-bench Verified uses 500 human-filtered GitHub issues; teams submit their own results, and its “Bash Only” view runs every model through the same minimal agent, the fairest comparison it offers. An LLM coding benchmark leaderboard rewards a narrow skill: a top place there says little about reasoning over documents.
Agentic and domain leaderboards
Agentic boards score a model and its agent together on multi-step tasks. Terminal-Bench ranks model-and-agent pairs on terminal tasks and shows 95% confidence intervals.
Finally, domain boards test one field. Ours covers geological reasoning over exploration reports, with separate model and harness views, and it is what we use to decide which AI model is best for geology at a given cost.
LLM benchmark leaderboard 2026: current leaderboards and resources
Checked on 30 September 2026. Rankings move with every release, so always check the date on any LLM benchmarks leaderboard before quoting it.
| Leaderboard | What it ranks | Where the scores come from | Uncertainty shown |
|---|---|---|---|
| Artificial Analysis | Models on an intelligence index, cost and speed | Runs its own evaluations with fixed settings | In its methodology, not on the board |
| BenchLM | Models across many public benchmarks | Aggregates published results; missing tests are not counted as zero | No |
| Vellum | Models on selected benchmarks, speed and cost | Provider data and independent runs, not attributed per score | No |
| Arena | Models by human preference | Pairwise votes | Yes: ± and rank spread |
| SWE-bench | Coding agents on real GitHub issues | Team submissions, some verified by maintainers | Not stated |
| Terminal-Bench | Model and agent pairs on terminal tasks | Submitted runs | Yes: 95% intervals |
| Groundtruth | Models and harnesses on geology questions | Self-reported, raw scores linked | Tiers from 95% intervals |
FAQs
What does an LLM benchmark leaderboard measure?
It measures how models score on one fixed set of tasks under one set of rules: a test set, a grader and fixed settings. It does not measure general ability, and it says little about your own work unless the tasks resemble it. The ranking is only as fine as the test’s resolution allows.
How often are LLM leaderboards updated?
It varies. For example, some update continuously as new models are evaluated or new votes arrive, and show a date on the page. Others are refreshed irregularly or have been retired, as Hugging Face’s Open LLM Leaderboard was in 2025. Check the update date before quoting a ranking, because each new release can reorder a board.
Can you trust leaderboard rankings?
Trust the tiers more than the order. Check who ran the tests, what was held constant, and whether the gaps exceed the measurement’s own noise. On our leaderboard only 2 of 7 gaps between neighbouring models were significant, so most of the order inside a tier was not a real difference.
What is the difference between a coding leaderboard and a general leaderboard?
A coding leaderboard scores models on programming tasks, such as fixing real GitHub issues, often with an agent running the code. A general leaderboard, on the other hand, mixes knowledge, reasoning and conversation. A model can rank highly on one and not the other, so pick the board whose tasks are closest to your own work.