TL;DR
- A leaderboard score printed to two decimals looks precise, but with 50 questions behind it, two close models may not be different at all.
- We measured the minimum detectable gap on our own benchmark: 0.27 to 0.45 points depending on the question set. Across eight models and 1,200 graded answers, only 2 of 7 gaps between neighbouring models were statistically significant.
- The same checks found one question set with its difficulty labels upside down, and showed the grading is fair to AI models it had never seen.
Key Takeaways
- A small score difference isn’t automatically a real one. Below a benchmark’s minimum detectable gap, a difference between two models can be measurement noise.
- Confidence intervals turn a ranked list into honest tiers. When two models’ intervals overlap, the data does not support calling one the winner.
- A benchmark should be tested against its own results. Comparing authored difficulty labels with actual scores caught one set where “easy” and “expert” were reversed.
- Grading models the rules never saw is a check for bias. Two strong models graded only after the rules were finished still scored near the top, so the rules reward correct answers, not a familiar style.
Benchmark statistical significance is the question every leaderboard skips: is the gap between two models larger than what chance and grading noise could produce? Groundtruth, our benchmark for geological reasoning, grades models on three districts of 50 questions each, scored 0 to 10 by one fixed AI judge. The latest results cover eight models and 1,200 graded answers.
This post is about how finely those results can be read, and the checks we ran on the benchmark itself.
What benchmark statistical significance means
A score gap is statistically significant when it is larger than the differences that the sample size and grading noise alone would produce. On a benchmark, that sets a minimum detectable gap: below it, a gap between two models is not evidence that one is better.
The number depends on how many questions you have, how much scores vary between them, and how consistent the judge is. It is a property of each question set, so it has to be measured, not assumed.
Benchmark confidence intervals: tiers, not ranks
Eight models with 95% intervals
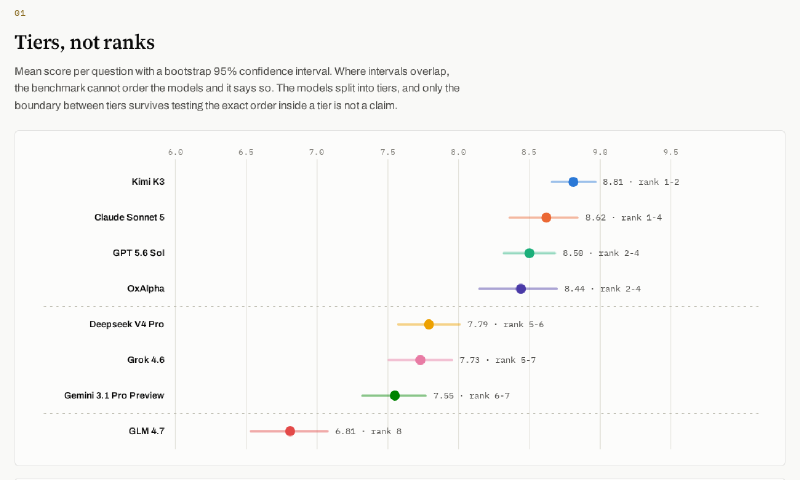
Each model’s result is its mean score per question with a bootstrap 95% confidence interval: the range its true mean plausibly sits in, given the questions we sampled.
| Model | Mean | 95% interval | Possible rank |
|---|---|---|---|
| Kimi K3 | 8.81 | 8.66 to 8.97 | 1 to 2 |
| Claude Sonnet 5 | 8.62 | 8.36 to 8.84 | 1 to 4 |
| GPT 5.6 Sol | 8.50 | 8.32 to 8.68 | 2 to 4 |
| OxAlpha | 8.44 | 8.15 to 8.69 | 2 to 4 |
| Deepseek V4 Pro | 7.79 | 7.57 to 8.01 | 5 to 6 |
| Grok 4.6 | 7.73 | 7.51 to 7.95 | 5 to 7 |
| Gemini 3.1 Pro Preview | 7.55 | 7.32 to 7.77 | 6 to 7 |
| GLM 4.7 | 6.81 | 6.53 to 7.07 | 8 |
Which neighbouring gaps are significant
Testing each pair of neighbours for benchmark statistical significance tells the same story. The gaps between Kimi K3, Claude Sonnet 5, GPT 5.6 Sol and OxAlpha were 0.19, 0.12 and 0.06 points, none of them significant. The gap from OxAlpha down to Deepseek V4 Pro was 0.65 and significant. Inside the middle group the gaps were 0.06 and 0.19, again not significant. The last gap, 0.73 from Gemini 3.1 Pro Preview to GLM 4.7, was significant.
So the honest reading is three tiers: four models at the top, three in the middle, and one below. Kimi K3 has the highest mean, and the benchmark cannot say it is better than Claude Sonnet 5. That is why the Groundtruth leaderboard reports tiers, and the charts behind these numbers are on the Three Districts results page.
Minimum detectable gap by district
LLM benchmark resolution, how finely a question set can separate real performance from noise, depends on the question set itself. We measured it separately for each district.
Resolution steps per district
For each district we measured three things: the spread between the top and bottom model; the minimum detectable gap, the smallest mean gap distinguishable from zero with 50 questions, measured on a representative model pair; and the number of resolution steps that fit between them, which is the range divided by that minimum gap.
| District | Top to bottom range | Minimum detectable gap | Resolution steps | Strong discriminators | Dead questions |
|---|---|---|---|---|---|
| Technical (NI 43-101) | 1.86 | 0.45 | 4.1 | 24 of 50 | 1 of 50 |
| WAMEX | 2.12 | 0.27 | 7.8 | 24 of 50 | 0 of 50 |
| USGS | 2.02 | 0.33 | 6.1 | 28 of 50 | 0 of 50 |
The same gap means different things on different districts. A 0.35-point difference between two models is real on WAMEX and within noise on Technical. Technical can separate about four levels of performance across its range; WAMEX can separate nearly eight.
Strong discriminators and dead questions
A strong discriminator is a question where the best and worst model scores differ by at least three points. A dead question is one where every model scored the same, so it costs a judge call per model and separates nothing. The Technical district has one, and it is the first candidate for replacement.
Why benchmark statistical significance needs more than one corpus
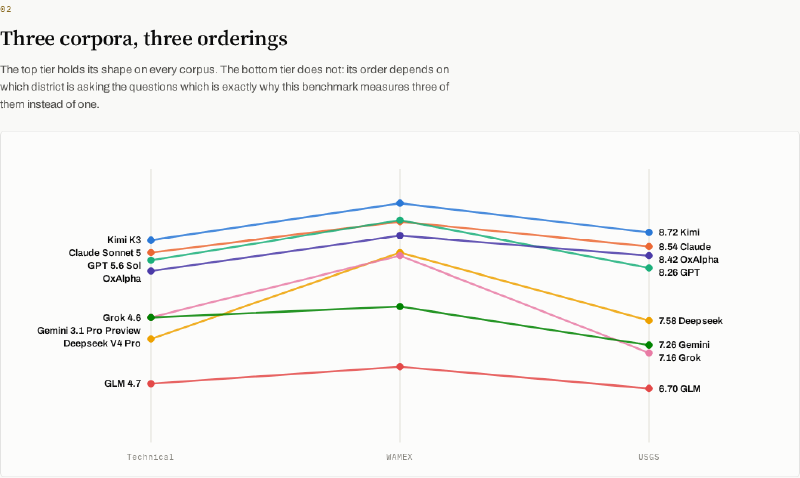
The top tier kept its shape on all three districts. The lower tiers did not. Deepseek V4 Pro scored lowest of the middle group on Technical (7.34 against 7.62 for both Grok 4.6 and Gemini 3.1 Pro Preview), yet highest of the three on WAMEX (8.46). Grok 4.6 dropped to 7.16 on USGS, below Gemini 3.1 Pro Preview at 7.26.
With one district, any of those orderings would have looked like the answer. Measuring three shows which parts of the ranking depend on the corpus, and which gaps reach benchmark statistical significance only on some of them.
Checking the difficulty labels against the data
Every question carries a difficulty label set during authoring: Easy, Moderate, Hard or Expert. Averaging all eight models’ scores by label shows whether the labels mean anything.
| District | Easy | Moderate | Hard | Expert |
|---|---|---|---|---|
| Technical | 8.06 | 7.98 | 7.77 | 7.54 |
| WAMEX | 8.11 | 8.71 | 8.40 | 7.96 |
| USGS | 7.39 | 7.53 | 8.07 | 8.75 |
Technical declines steadily as the labels get harder. WAMEX’s Expert questions are its hardest, although its Easy questions score below its Moderate ones. USGS runs backwards: models do best on the questions labelled Expert, and the Easy questions separate them most.
The scores themselves are unaffected, because every question is graded against its own rubric whatever its label. The difficulty breakdown for USGS is not reliable, so we report the inversion and do not quote per-difficulty analysis for that district. An authored label is a prediction, and the results are the test of it.
Checking the grading rules for bias with new models
Think of a teacher who writes the marking guide while reading five students’ papers. The risk is that the guide ends up rewarding how those five students write, not whether their answers are right. It is the same risk covered from the calibration side in Testing the Rubric Before You Test the Model.
Our grading rules, the rubrics, were written the same way, while reading answers from five AI models. So we did what that teacher should do: we graded two more models whose answers we had never looked at, Claude Sonnet 5 and then OxAlpha. Both are known to be strong models. If the rubrics only rewarded the style of the first five, these two would have scored lower than expected.
They didn’t. Both landed in the top tier on all three districts, which means the rubrics reward correct answers, not a familiar style.
Limits of a single benchmark run
Each model was scored once per district. The judge is not perfectly deterministic even at temperature 0, so a gap close to a district’s minimum detectable gap could move on a re-run. Tier membership has been stable; exact positions inside a tier are not claims.
The judge also comes from a model family that competes on the board, a conflict disclosed in full in An LLM Judge That Can’t Invent a Score. GPT 5.6 Sol is in the top tier and places third under that judge. It not winning is some evidence against self-preference, and an independent judge is on the roadmap. What these tiers mean for choosing a model, with cost alongside, is in Which AI Model Is Best for Your Geology?
Rules for reading benchmark statistical significance
- Report tiers from confidence intervals, and state which neighbouring gaps are significant.
- Compare any claimed improvement with the minimum detectable gap of the district it was measured on.
- Use more than one corpus before drawing a conclusion about the lower half of a ranking.
- Check authored labels such as difficulty against the scores before quoting a breakdown.
- Keep some models out of writing the grading rules, then grade them afterwards to check the rules for bias.